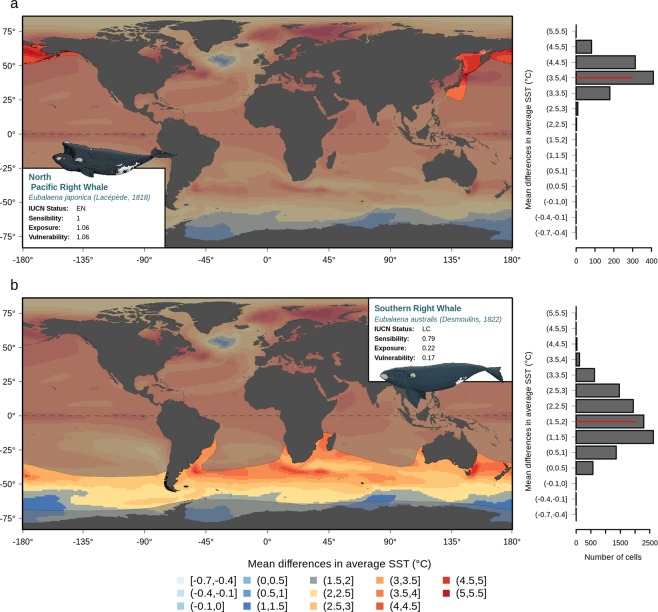
Figure 1.
Projected climate change within the geographical species ranges. Projected climate change within the geographical range of the North Pacific right whale (a) and the Southern right whale. (b) Colors show the magnitudes of the difference in the mean sea surface temperature between the baseline period (1971–2000) and the end of the century (2070–2099) according to the RCP8.5 scenario. The geographical range is represented in bright colors that contrast with the dark background. These maps and barplots allow visualization of the exposure, i.e., the degree of climate change (either warming for positive values of SST or cooling for negative values) that a species is likely to face within its range. Maps were created using R 3.6.0 software (https://www.r-project.org/).

