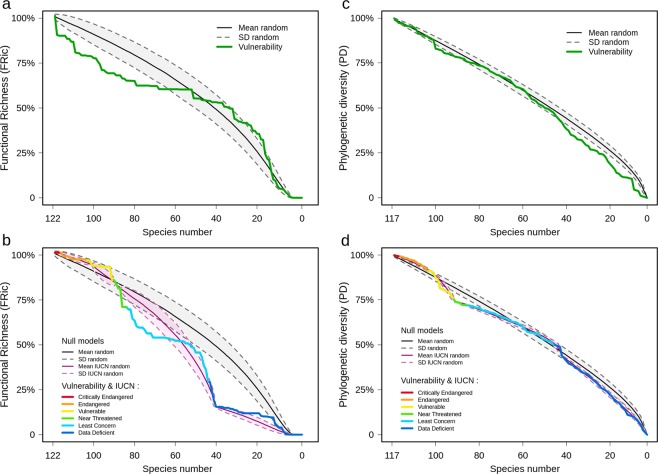
Figure 4.
Scenario of the potential loss of functional richness and phylogenetic diversity in the global marine mammal fauna. Potential loss of functional richness (a,b) and phylogenetic diversity (c,d) in the global marine mammal fauna according to the RCP8.5 scenario for the end of the century (2070–2099). The upper graphs (a,b) show two erosion scenarios; one was repeated 999 times with a randomly selected order of species extinctions (dark continuous line) and is shown with the corresponding standard deviation, while the second had the species extinctions occur in order of their vulnerabilities to climate change (green continuous line). The lower graphs (c,d) show two random erosion scenarios. One was repeated 999 times with a randomly selected order of species extinctions (dark continuous line) and a second where the species were grouped according to their IUCN categories (critically endangered (CR), endangered (EN), vulnerable (VU), near threatened (NT), least concern (LC) and data deficient (DD)) prior to randomization. Finally, the lower graph presents a scenario (“Vulnerability & IUCN”, multicolor line) with the species grouped by IUCN categories and placed in decreasing order within each group according to their vulnerabilities to climate change. The ranking of the species differs between each pair of vulnerability scenarios, preventing direct comparison.

