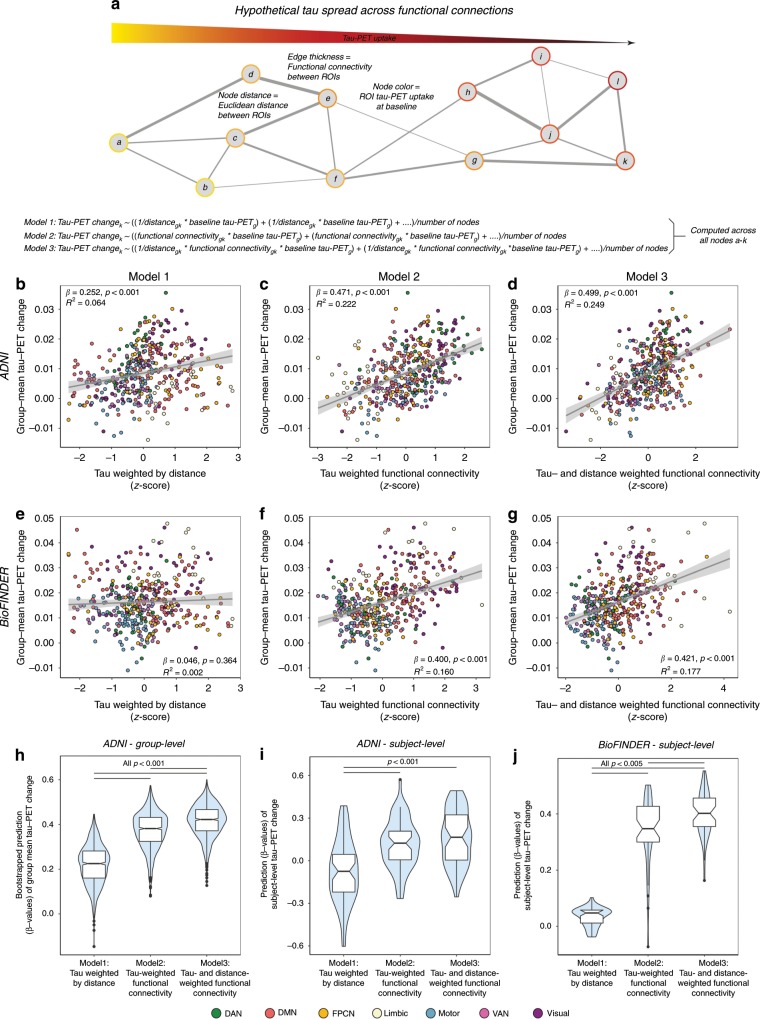
Fig. 7. Prediction of longitudinal tau-PET change.
a Hypothetical network spreading model of tau pathology. Each node within the network represents a brain region, where color indicates local tau pathology, distance between regions indicates connection length (i.e. Euclidean distance) and edge thickness indicates functional connectivity strength. Example formulas for models 1–3 illustrate how we computed tau-weighted distance (Model 1), tau-weighted functional connectivity (Model 2) or tau- & distance-weighted functional connectivity (Model 3) that were used to model group-mean annual tau-PET change in the 53 Aβ + ADNI (b–d) and 41 Aβ + BioFINDER subjects (e–g). For ADNI, we computed the association illustrated in (b–d) for 1000 bootstrapped samples (h). Resulting β-value distributions (y-axis) were compared between Models 1–3 using an ANOVA with post-hoc Tukey-test (x-axis). f Prediction models 1–3 were assessed on the subject-level for 53 ADNI Aβ+ and 41 BioFINDER Aβ+ subjects using subject-level annual tau-PET change and subject-level connectivity (ADNI) or HCP-derived group-level functional connectivity (BioFINDER). Subject-derived β-value distributions were compared across Models 1–3 using an ANOVA. Source data are provided in a Source data file. Linear model fits are indicated together with 95% confidence intervals.

