Figure 1.
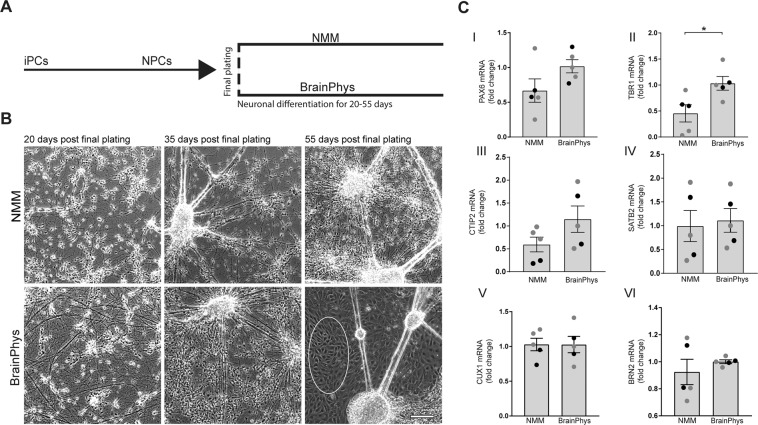
Differentiation of neuroprogenitor cells towards cortical neurons in neuronal maintenance- or BrainPhys medium. (A) Schematic illustration of the experimental setup. Human iPSCs are differentiated into neuroprogenitor cells (NPCs) according to Shi et al.12 up until final plating. Thereafter, the NPCs are further differentiated in NMM or BrainPhys for up to 55 days. (B) Representative phase-contrast images of the cultures 20, 35 and 55 days after final plating in NMM or BrainPhys medium. An increased neurite network is observed already after 20 days in BrainPhys (lower, left panel) as compared to NMM (upper, left panel). After 35 days in BrainPhys (lower, mid-panel), the cultures contain more neurons as compared to NMM (upper mid-panel), comparable to the cultures after 55 days of differentiation in NMM (upper, right panel). Extensive amounts of non-neuronal cells appear after 55 days in BrainPhys-medium (lower, right panel), marked with a white circle. Scale bar = 200 µm. (C) NPCs differentiated in BrainPhys or NMM for up to 35 days and investigated for changes in mRNA levels of markers for cortical layers measured with qPCR. (I) PAX6 (paired-box transcription factor 6) mRNA, a marker for radial-glial progenitor cells, shows a trend to increase in BrainPhys-cultured cells, although not reaching statistical significance. (II) TBR1 (T-Box Brain Protein 1) mRNA, a marker for cortical layer-VI neurons, increases significantly with BrainPhys. (III) CTIP2 (B-cell lymphoma/leukemia 11B) mRNA, a marker for cortical layer-V neurons, shows a trend to increase in BrainPhys-cultured cells, although not reaching statistical significance. Upper-layer markers SATB2 (Special AT-Rich Sequence-Binding Protein 2) (IV), CUX1 (cut like homeobox 1) (V) and BRN2 (Brain-Specific Homeobox/POU Domain Protein 2) (VI) mRNA levels do not differ between NMM- and BrainPhys-cultured cells. Mean values of five separate experiments on neurons from two different iPSC lines (Ctrl1 marked with grey circles and ChiPSC22 marked with black circles) were analysed with Student’s t-test. *p ≤ 0.05. Bars represent mean +/− SEM.

