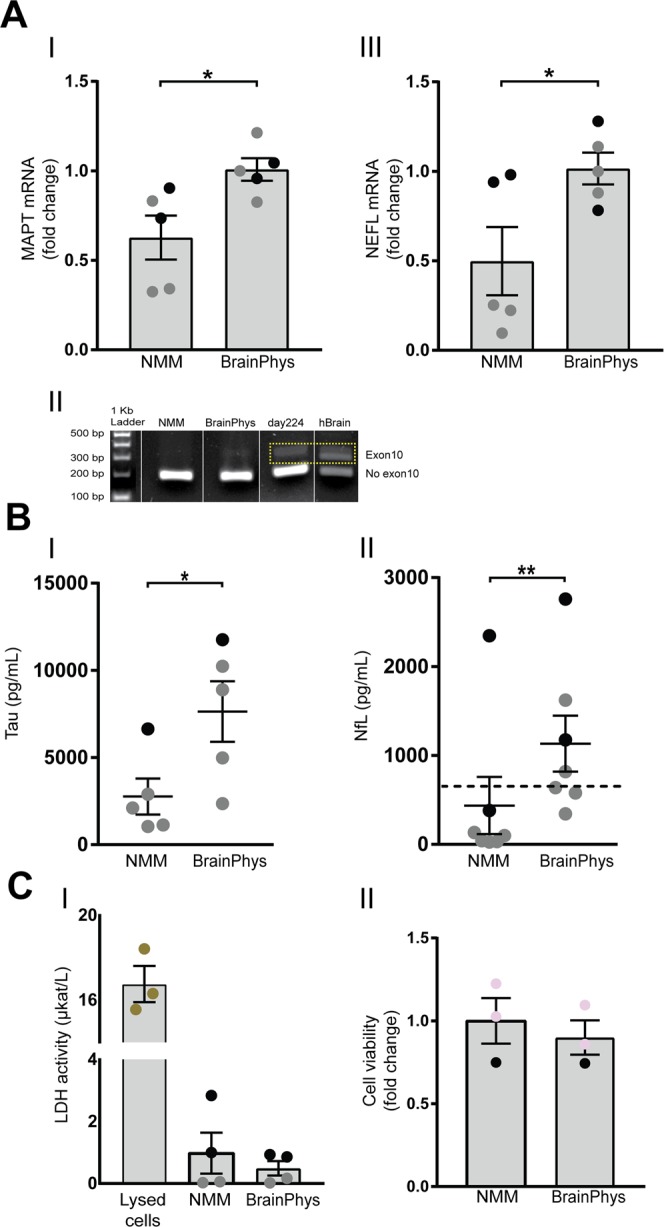
Figure 4.

BrainPhys increases media concentrations of axonal proteins. NPCs differentiated in BrainPhys or NMM for up to 35 days and investigated for changes in mRNA expression and secretion of axonal proteins. (A) mRNA levels of MAPT (I), the gene coding for Tau, and NEFL (III), the gene coding for NfL, measured with qPCR both increase significantly in the BrainPhys-cultured cells. Mean values of five separate experiments on neurons from two different iPSC lines (Ctrl1 marked with grey circles and ChiPSC22 marked with black circles) were analysed with Student’s t-test. *p ≤ 0.05. Bars represent mean +/− SEM. (II) One representative gel comparing tau splice variants in NMM- and BrainPhys cultures shows that BrainPhys did not induce the mature form of tau including exon 10. Human whole brain cDNA and neurons differentiated in NMM for 224 days are included as positive controls. The whole gel image is shown in Supplementary Fig. 1F. (B) Concentrations of secreted Tau and NfL into the cell-conditioned media measured with ELISAs. Culturing the cells in BrainPhys significantly increases the concentration of Tau (I) and NfL (II) in the cell media, where the concentrations of NfL in the NMM-cultured cells is mostly under the detection limit of 50 pg/mL (dotted line). Tau: Mean values of five separate experiments on neurons from two different iPSC lines (Ctrl1 marked with grey circles and ChiPSC22 marked with black circles) were analysed with Student’s t-test. NfL: Mean values of six separate experiments on neurons from two different iPSC lines (Ctrl1 marked with grey circles and ChiPSC22 marked with black circles) were analysed with Student’s t-test. *p ≤ 0.05, **p ≤ 0.01. Lines represent mean +/− SEM. (C) (I) Released lactate dehydrogenase (LDH) into the cell-conditioned media, measured with LDH activity assay. No significant differences in LDH release is observed between cells cultured in NMM or BrainPhys. As a positive control, cells lysed in 1% (v/v) Triton-X100 to release all LDH is included. Mean values of four separate experiments on neurons from two different iPSC lines (Ctrl1 marked with grey circles and ChiPSC22 marked with black circles) were analysed with Student’s t-test. (II) Cell viability determined by measuring acridine orange-positive (total) cells and DAPI-positive (dead) cells, using image cytometry. No significant difference is observed between NMM and BrainPhys cultures. Mean values of three separate experiments on neurons from two different iPSC lines (WTSIi015-A marked with pink circles and ChiPSC22 marked with black circles) were analysed with Student’s t-test. Bars represent mean +/− SEM presented as fold change relative to NMM.
