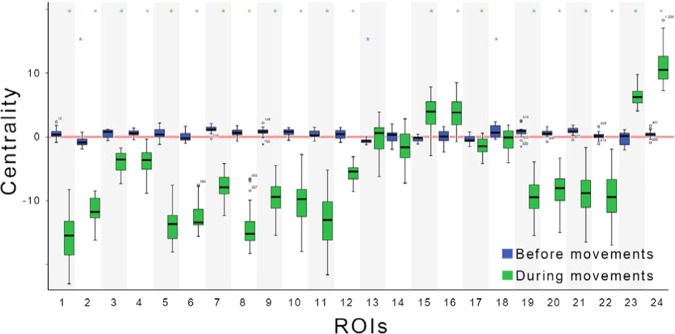
Figure 5.
Changes in centralities of 24 ROIs before (from −330 ms to −170 ms corresponding to cluster 2) and during (from 160 ms to 500 ms corresponding to the clusters 9 and 10) movements compared with the baseline values from −560 ms to −400 ms and from −740 ms to −400 ms, respectively. Blue boxes indicate centralities before movements. Green boxes depict centralities during movements. The red line indicates the baseline. Error bars show standard error of mean (SEM). Stars on bars denote significance levels. Statistical significances were calculated by Bonferroni-corrected paired sample t-test for each ROI. ROI 1: left PF; 2: right PF; 3: left SMA; 4: right SMA; 5: left PMd; 6: right PMd; 7: left M1; 8: right M1; 9: left S1; 10: right S1; 11: left ACC; 12: right ACC; 13: left PUT; 14: right PUT; 15: left PAL; 16: right PAL; 17: left THA; 18: right THA; 19: left PPC; 20: right PPC; 21: left V1; 22: right V1; 23: left CB; and 24: right CB. *P < 0.05.

