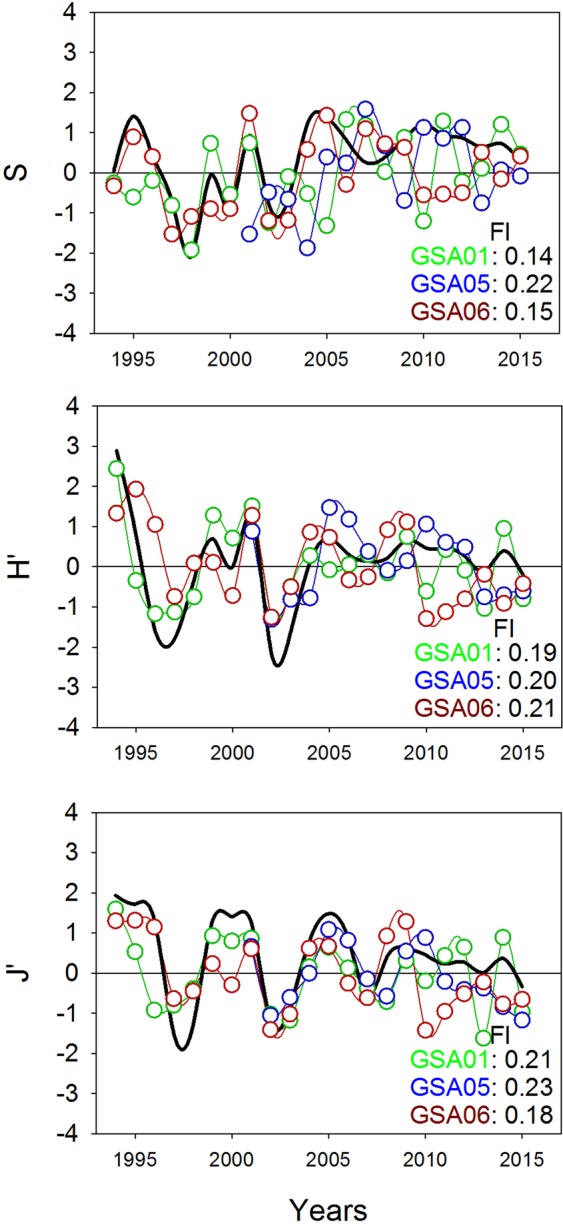
Figure 2.

Common temporal trends (black lines) from dynamic factor analysis (DFA) applied to species richness (S), Shannon diversity (H’) and evenness (J’) per geographical sub-area (GSA) considered by the General Fisheries Commission for the Mediterranean in the study area (GSA01: Northern Alboran Sea, as green lines; GSA05: Balearic Islands, as blue lines; GSA06: Northern Spain, as red lines) during the periods 1994-2015 in GSA01 and GSA06, and 2001–2015 in GSA05. Factor loading (Fl) results for each GSA are indicated in the bottom right corner of each graph.
