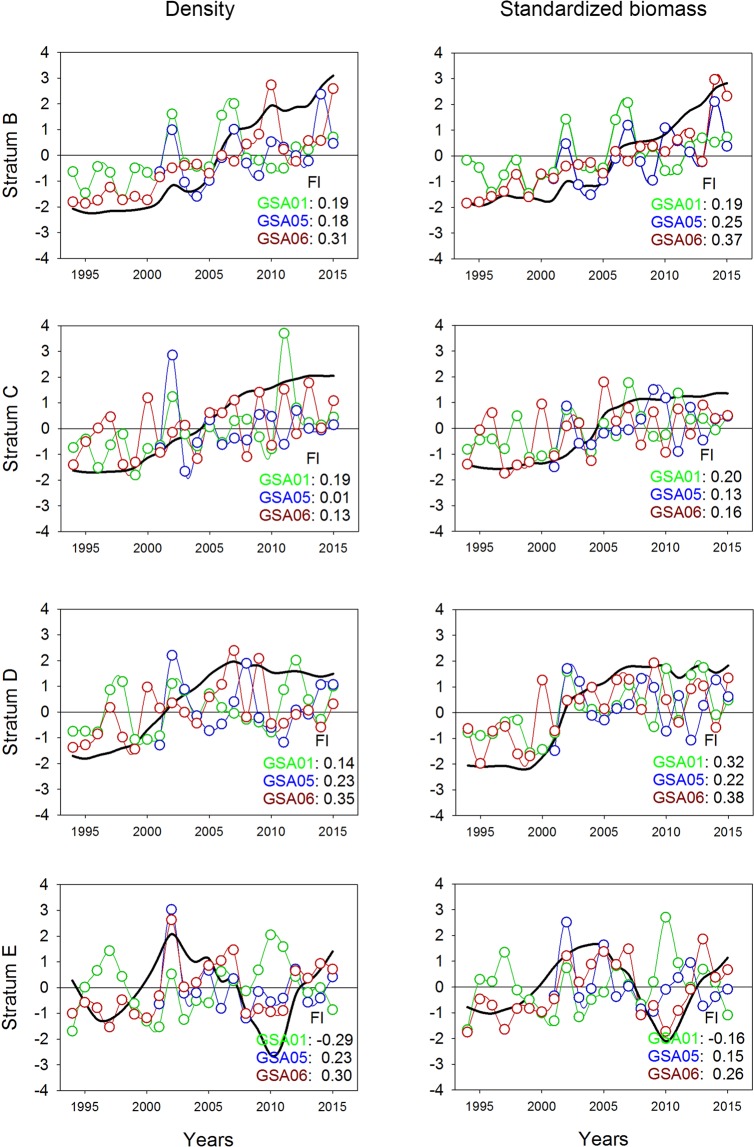
Figure 3.
Common temporal trends (black lines) from dynamic factor analysis (DFA) applied to density and standardized biomass of sharks per geographical sub-area (GSA) considered by the General Fisheries Commission for the Mediterranean in the study area (GSA01: Northern Alboran Sea, as green lines; GSA05: Balearic Islands, as blue lines; GSA06: Northern Spain, as red lines) and depth stratum (B: 50–100 m; C: 101–200 m; D: 201–500 m; E: 501–800 m) during the periods 1994–2015 in GSA01 and GSA06, and 2001–2015 in GSA05. Factor loading (Fl) results for each GSA are indicated in the bottom right corner of each graph.

