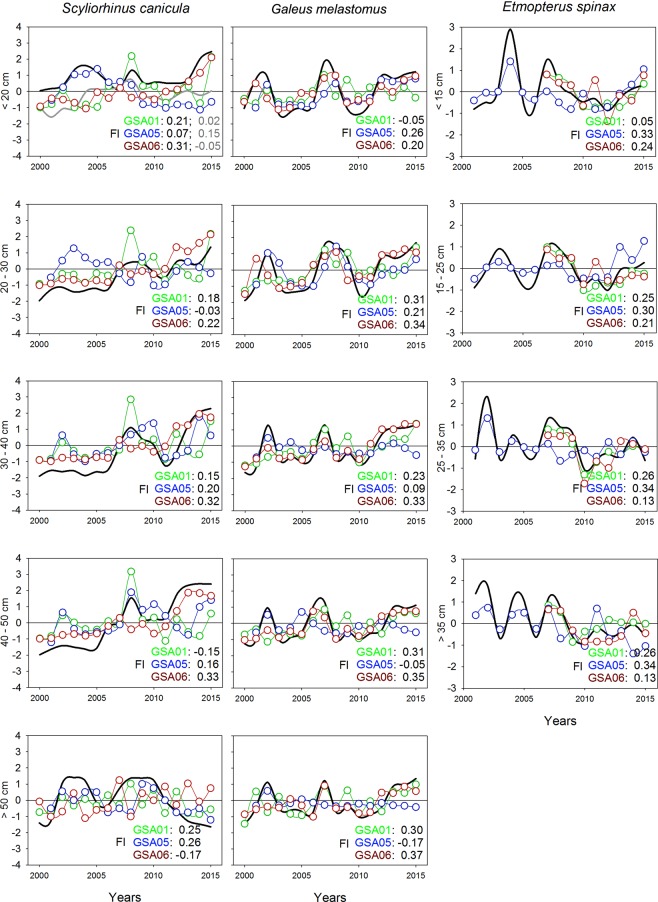
Figure 7.
Common temporal trends (black lines) from dynamic factor analysis (DFA; grey lines correspond to the second common trend identified) applied to density by length category of Scyliorhinus canicula, Galeus melastomus and Etmopterus spinax per geographical sub-area (GSA) considered by the General Fisheries Commission for the Mediterranean in the study area (GSA01: Northern Alboran Sea, as green lines; GSA05: Balearic Islands, as blue lines; GSA06: Northern Spain, as red lines). The length categories of S. canicula and G. melastomus were the same. Factor loading (Fl) results for each GSA are indicated at the bottom right corner of each graphic.

