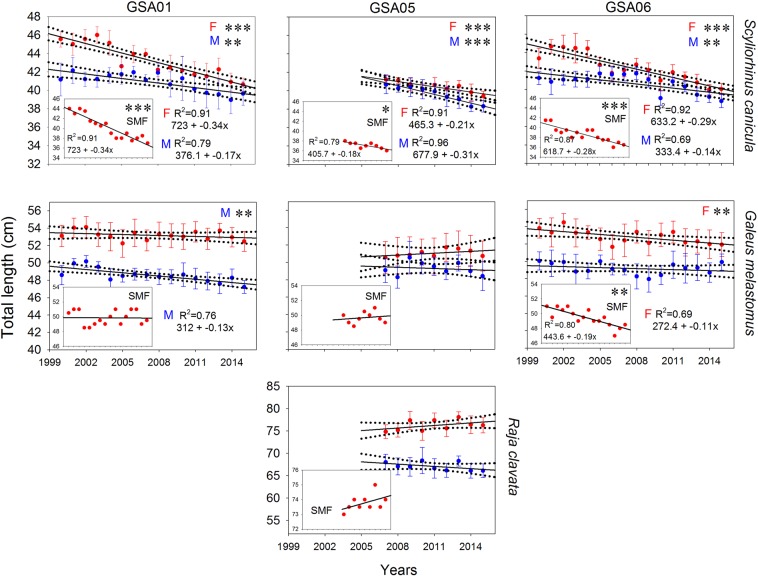
Figure 9.
Linear regression models of mean annual length at first maturity (L50; standard deviation values are shown) for females (in red) and males (in blue) of Scyliorhinus canicula and Galeus melastomus per geographical sub-area (GSA) considered by the General Fisheries Commission for the Mediterranean in the study area (GSA01: Northern Alboran Sea; GSA05: Balearic Islands; GSA06: Northern Spain), and for Raja clavata in GSA05, during the periods 2000–2015 in GSA01 and GSA06 and 2007–2015 in GSA05. The SMF plots show the linear regression models for the smallest mature female. Dashed lines show 95% confidence intervals for regression lines, while asterisks indicate statistical significance: *p < 0.05; **p < 0.01; ***p < 0.001.

