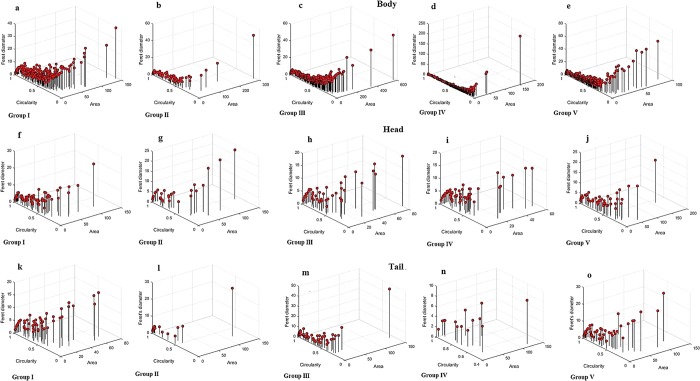
Figure 7.
Quantitative analysis of individual beta cell distribution in the rat pancreas administrated with crude polysaccharide and rhamnose enriched polysaccharide from G. lithophila. 3D visualization in scatter plot of islet size distribution with beta cells in various size and shape. Circularity represents the roundness of structure (1.0 denotes perfect circle), Feret’s diameter (µm) displays the distance within structure. (a–e) showed the quantification of beta cells in body region of pancreas from group I–V, (f–j) showed the quantification of beta cells in head region of pancreas from group I–V, (k–o)showed the quantification of beta cells in tail region of pancreas from group I–V.

