Figure 1.
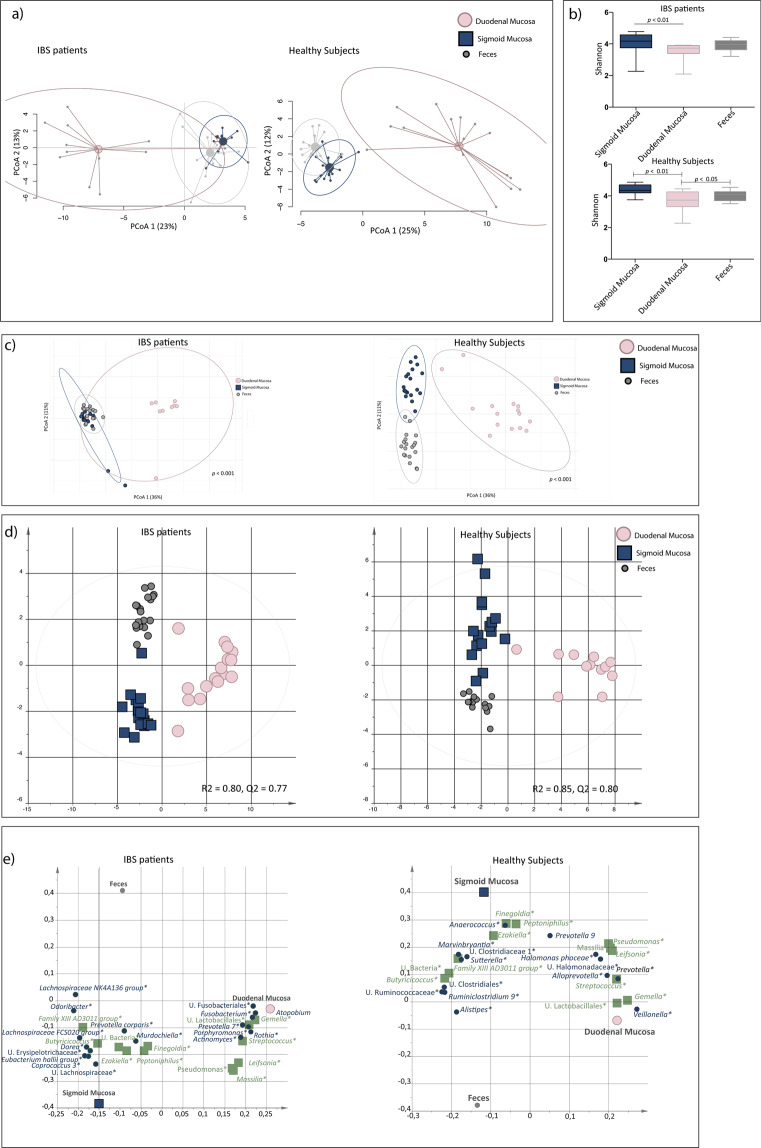
The fecal and mucosa-associated bacterial profiles of the small intestine and colon of IBS patients and healthy subjects. Profiles of the relative abundance of fecal bacteria (grey circles) and the mucosa-associated bacteria from the sigmoid colon (blue squares) and the duodenum (pink circles) of irritable bowel syndrome (IBS, n = 16) and healthy subjects (n = 19). (a) Principal component analysis (PCA) of IBS and healthy. (b) Shannon diversity of the bacterial composition of fecal samples and the mucosal-associated bacterial composition of the sigmoid colon and the duodenum of IBS and healthy. (c) Beta-diversity of the bacterial composition of fecal samples and the mucosa-associated bacterial composition of the sigmoid colon and the duodenum of IBS and healthy. (d) Multivariate orthogonal partial least squares-discriminant analysis (OPLS-DA) of IBS and healthy, respectively, with bacteria as X-variables and fecal samples, biopsies from the sigmoid colon and biopsies from the duodenum, respectively, as Y-variables. (e) Loading scatter plot from the OPLS-DA showing the separation between fecal samples and the mucosa-associated bacterial composition of the sigmoid colon and the duodenum, respectively, with the bacterial composition. Green squares represent bacteria which relative abundance contributed the most to the separation in the bacterial composition of the different sample types of both IBS and healthy, while blue circles are exclusively shown to contribute to the separation of the bacterial compositions of the different sample types of IBS or healthy, respectively. * = Significant difference between sample type according to the Kruskal-Wallis test. U. = Unclassified.

