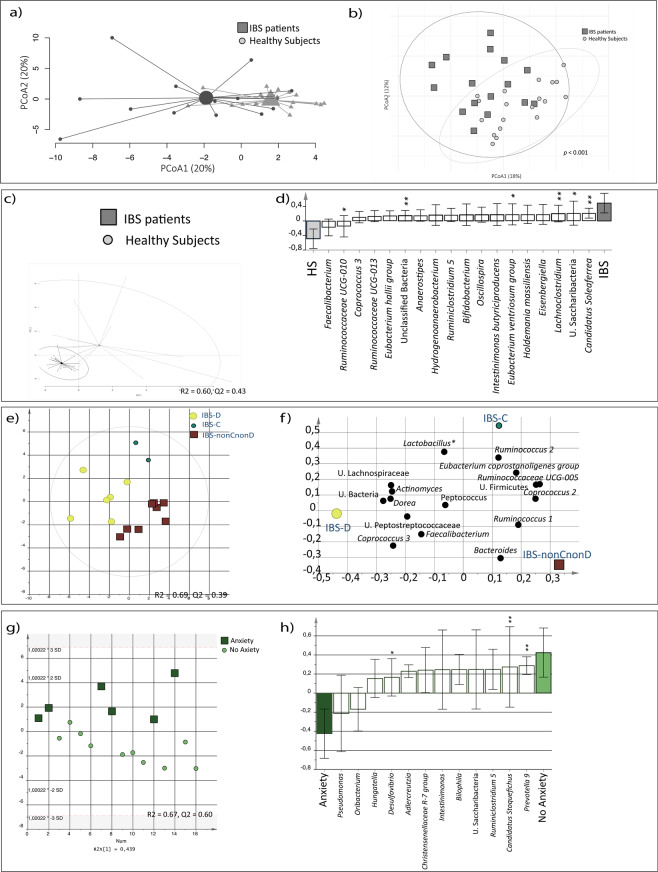
Figure 2.
Fecal bacterial profiles of IBS patients and healthy subjects. Fecal bacterial composition of IBS patients (n = 16, dark grey squares) and healthy subjects (n = 19, light grey circles). (a) Principal component analysis (PCA) of IBS and healthy. (b) Beta-diversity analysis of IBS and healthy. (c) OPLS-DA showing the separation between IBS and healthy, respectively, and the fecal bacterial composition. Multivariate analysis was performed with fecal bacteria as X-variables and IBS and healthy, respectively, as Y-variables. (d) OPLS-DA loading column plot of the fecal bacteria that contributed the most to the separation between IBS and healthy. (e) Score scatter plot from the OPLS-DA showing the separation between the diarrhea predominant (IBS-D, n = 6; yellow large circle), constipation predominant (IBS-C, n = 2, green small circle) and the nonCnonD-IBS (n = 8, dark red square) subtypes, respectively, and the fecal bacterial composition. Multivariate analysis was performed with fecal bacteria as X-variables and IBS subtypes, respectively, as Y-variables. (f) OPLS-DA loading scatter plot of the fecal bacteria that contributed the most to the separation between IBS subtypes. (g) Score scatter plot from the OPLS-DA showing the separation between IBS patients with anxiety (n = 6; dark green squares), and without anxiety (n = 10, light green circles), respectively, and the fecal bacterial composition. Multivariate analysis was performed with fecal bacteria as X-variables and IBS patients with and without anxiety, respectively, as Y-variables. (h) OPLS-DA loading scatter plot of the fecal bacteria that contributed the most to the separation between IBS patients with and without anxiety. * = Significant difference between groups according to the Kruskal-Wallis test or the Mann-Whitney test. U. = Unclassified.

