Figure 4.
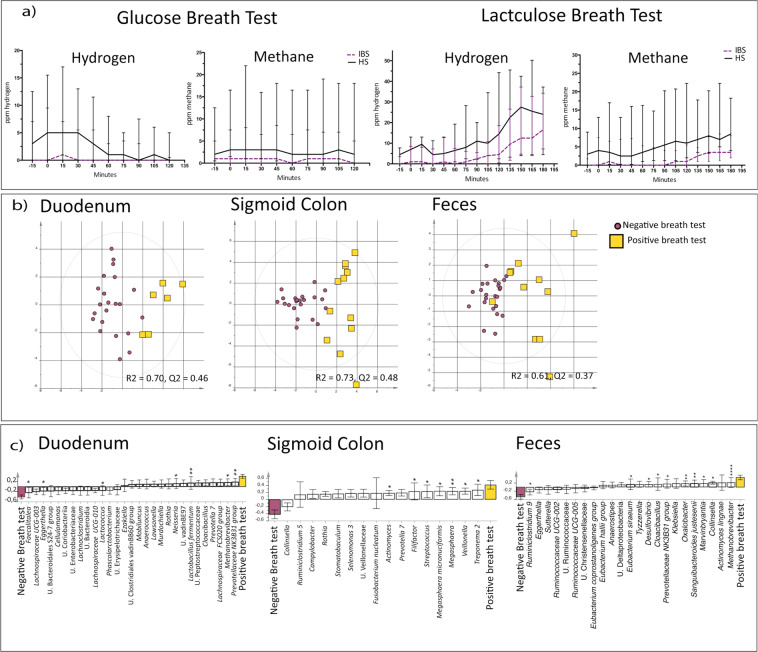
Glucose or lactulose breath tests and their link to the bacterial composition. (a) Exhaled H2 and CH4 over time, after glucose and lactulose ingestion in IBS (n = 17, purple dotted line) and healthy (n = 20, black solid line). (b) Multivariate orthogonal partial least squares-discriminant analysis (OPLS-DA) score scatter plot of the bacterial composition of feces, the mucosa-associated bacterial composition in the colon and the mucosa-associated bacterial composition in the duodenum of IBS and healthy with positive glucose or lactulose breath test (yellow squares) based on elevated baseline levels of H2 and/or CH4 (>15 ppm) compared to those with a negative test (purple circles). (c) OPLS-DA loading scatter plot showing the separation between IBS and healthy with positive fasting glucose or lactulose breath test compared to those with a negative test, and the bacterial composition of feces, the mucosa-associated bacterial composition in the colon and the mucosa-associated bacterial composition in the duodenum, respectively. Multivariate analysis was performed with bacteria as X-variables and IBS and healthy with a positive fasting breath test and those with a negative test at baseline, respectively, as Y-variables. * = Significant difference between those with a positive test compared to those with a negative test according to the Kruskal-Wallis test. U. = Unclassified.

