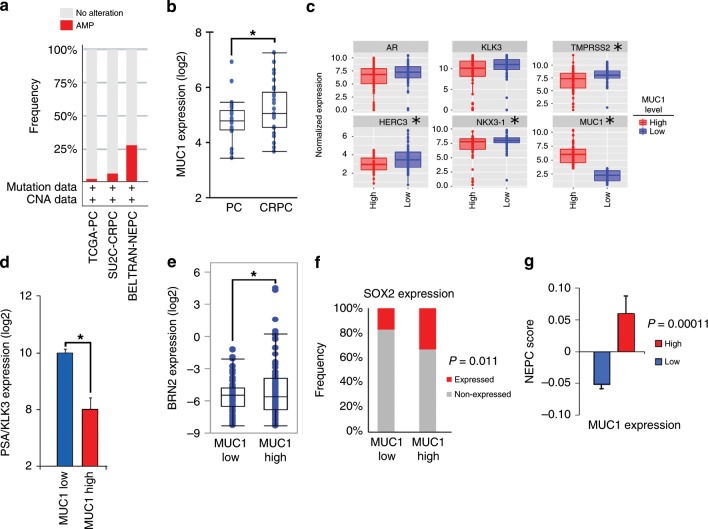
Fig. 8. MUC1 overexpression associates with NE differentiation.
a MUC1 copy-number alteration (CNA) data for the TCGA-PRAD51, SU2C-CRPC50, and NEPC9 cohorts. b Localized prostate cancer, hormone-naïve samples (n = 22) were compared to metastatic CRPC samples (n = 29)9,50. Multiple probe set IDs for MUC1 were averaged for each patient sample after normalization to obtain a representative expression value for the gene. The center line indicates the median value, bounds of the box denote 25th (lower) and 75th (upper) percentiles, and whiskers indicate minimum (lower) and maximum (upper) values excluding outliers. Student’s t-test was used to compare groups (p-value = 0.038). c Normalized expression data for the SU2C-CRPC cohort were downloaded from cBioPortal, and median expression used to group samples into MUC1 high and MUC1 low groups. Expression of AR and AR target genes was assessed in MUC1 high and MUC1 low groups using a Wilcoxon rank-sum test. Boxplots represent the 1st quartile, median and 3rd quartile of each distribution. Whiskers extend to the maximum and minimum values up to 1.5*interquartile range (IQR). d–g Data were downloaded from cbioportal4. NEPCs and CRPCs were analyzed together. d Samples were dichotomized by MUC1 high (n = 105) and MUC1 low (n = 106) expression defined by the normalized median expression value. Samples were analyzed for KLK3 expression. Student’s t-test was used to compare groups (p < 0.0001). e Samples were dichotomized by MUC1 high (n = 116) and MUC1 low (n = 96) expression defined as normalized expression value ≥ 1.4 or < 1.4. Samples with undetectable BRN2 values were excluded. Student’s t-test was used to compare groups (p = 0.038). f Samples were dichotomized by MUC1 high (n = 106) and MUC1 low (n = 106) expression defined as normalized median expression value. Presence of SOX2 expression was defined as an FKPM value > 0. Fisher’s exact test was used to compare groups. g Samples were dichotomized by MUC1 high (n = 80) and MUC1 low (n = 66) expression defined as normalized expression value. Samples with NEPC values were retained for analysis. NEPC score was calculated using polyA RNA-seq data as described4. Student’s t-test was used to compare groups (p = 0.0001).

