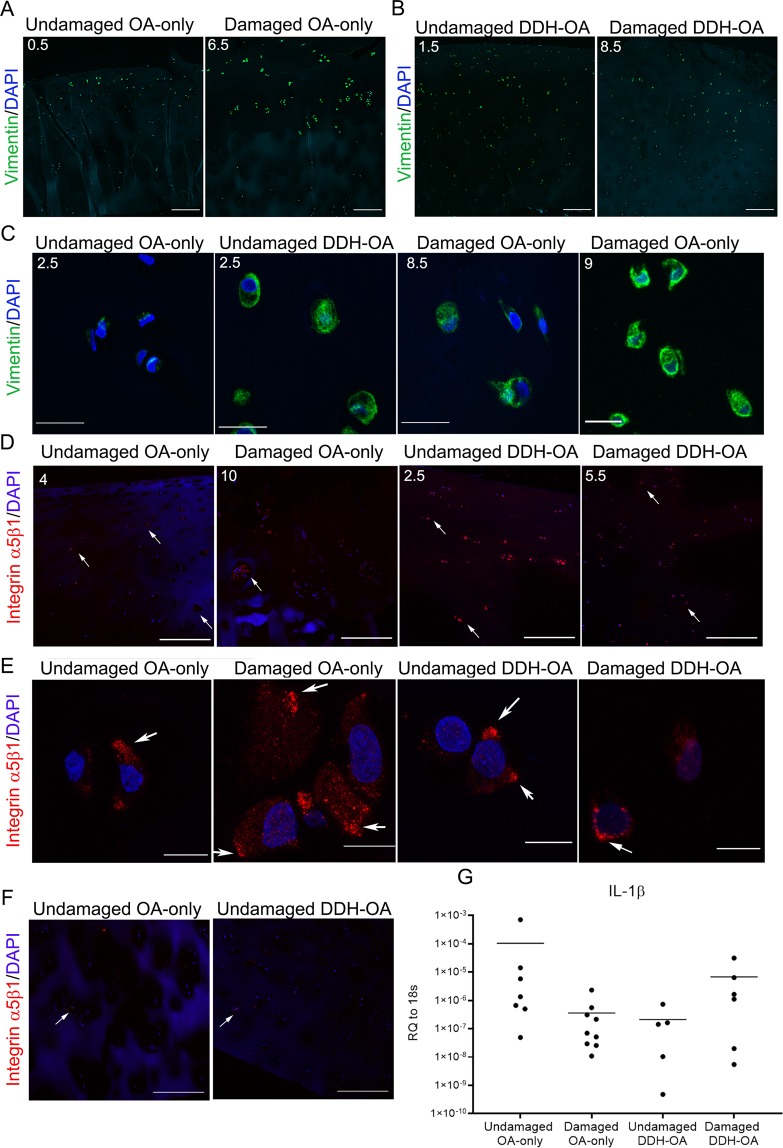
Figure 6.
Additional signs of osteoarthritic pathological phenotype of chondrocytes were detected in undamaged DDH-OA samples. (A) Vimentin intermediate filaments staining (green) of an undamaged and a damaged OA-only sample. DAPI was used as nuclear counterstain. (B) Vimentin (green) and DAPI staining of undamaged and damaged DDH-OA cartilage. (C) Images of vimentin + DAPI staining in chondrocytes in situ showing that undamaged DDH-OA samples have more vimentin staining than undamaged OA-only with the same MMS and is more comparable to samples of damaged OA-only with higher MMS. MMS are indicated in the upper left corner of each picture. (D) Integrin α5β1 (red) + DAPI staining of all groups. Surface and middle layers are shown. White arrows indicate examples of positive cells throughout cartilage depth. (E) Images of chondrocytes in situ from samples in D. White arrows indicate integrin α5β1 clustering. (F) Integrin α5β1 staining in deep layers of undamaged OA-only and undamaged DDH-OA cartilage. White arrows indicate examples of positive cells. (G) mRNA expression of IL-1β in the 4 groups of samples. No significant differences were detected between the groups. Values are shown as relative quantity (RQ) to 18 s in Log10 scale for better display. Lines represent average. Scale bars for A, B, D, and F are 200 µm. Scale bars for C and E are 10 µm.

