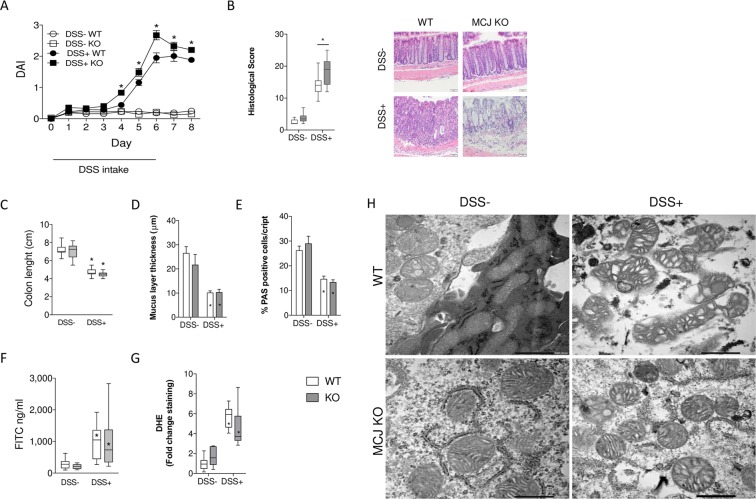
Figure 1.
Experimental design: WT and MCJ-deficient mice received 3% DSS sterile water for 6 days, followed by 2 days of regular drinking water. (A) DAI values over the experimental period; data are expressed as means ± SEM (n = 20); *p < 0.05 versus DSS control group. (B) Histological scores. Error bars indicate SEM. Representative images. (C) Colon length (cm). (D) Mucus layer thickness (µm). (E) Goblet cells: % of positive cells stained with PAS (Periodic Acid-Schiff). (F) Permeability to the tracer FITC-dextran (ng/ml). (G) Reactive oxygen species (ROS) measured by dihydroethidium (DHE) staining in colon sections. (H) Electron microscopy showing mitochondrial morphology in DSS induced colitis groups (Scale bar: 500 nm). White: wild-type; grey: MCJ-deficient. Box and whisker plots of median, quartiles and range, n = 10 mice per group at a minimum. Statistical analysis: two-way ANOVA. “*” in boxes versus control, “*” versus WT DSS treated.

