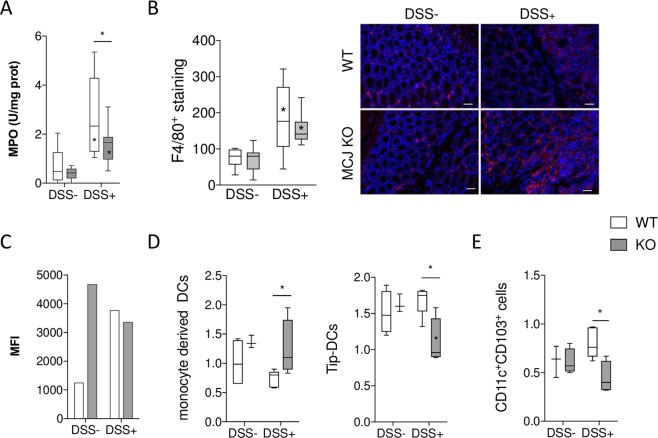
Figure 2.
(A) MPO activity (U/mg protein). (B) Macrophage infiltration in the colon of DSS-treated mice. Representative immunofluorescence sections of colonic macrophages by F4/80 marker. Bar represents 50 µm. (C) The average of the mean fluorescence intensity (MFI) determined by flow cytometry showing the expression of TNF bound to membrane present in macrophages isolated from colon tissue. The values presented correspond to one experiment of two with similar results. (D,E) Flow cytometry analysis of lymphoid populations in mesenteric lymphoid nodes. White: wild-type; grey: MCJ-deficient. Box and whisker plots of median, quartiles and range, n = 7 mice per group at a minimum. Statistical analysis: two-way ANOVA. “*” in boxes versus control, “*” versus WT DSS treated.

