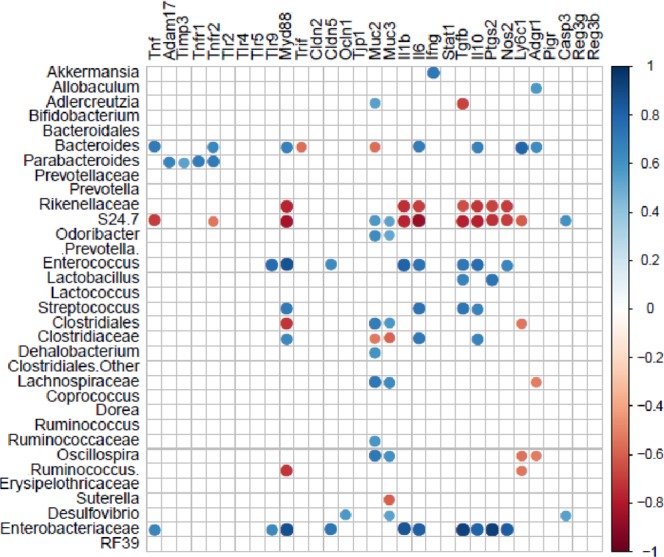
Figure 6.

Pearson correlation of microbial community and host gene expression in the colon from WT and MCJ-deficient mice, treated or not with DSS. Pearson correlation analysis indicated that the variation in bacterial community composition and gene expression from the colon wall interaction had significant correlations (P = 0.001). The size and intensity of color for each circle represents the strength of the correlation (the larger, darker circles demonstrate a strong correlation), blue colors illustrate positive correlations and red colors illustrate negative correlation coefficient.
