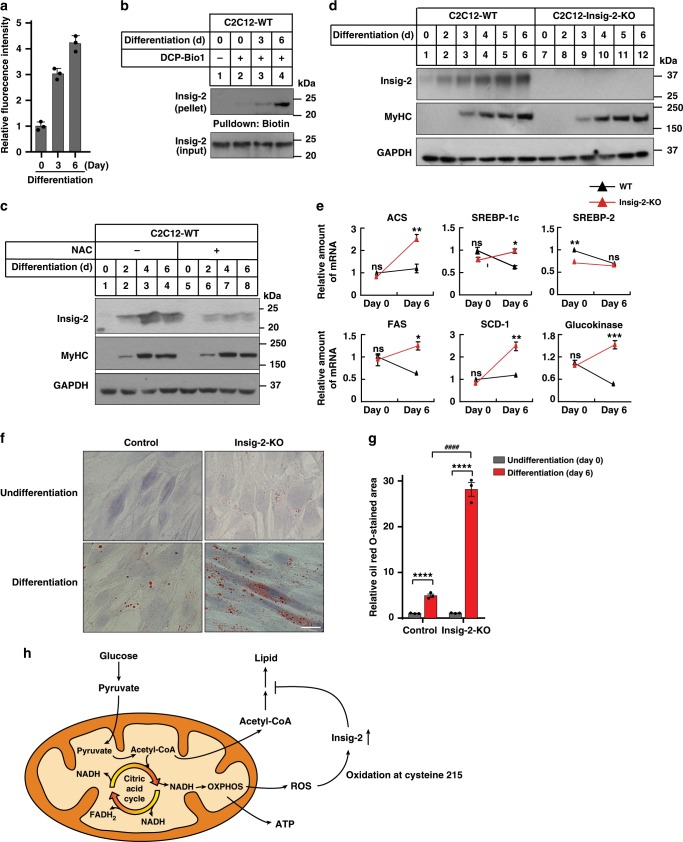
Fig. 5. Depletion of Insig-2 increases lipid accumulation in differentiated C2C12 cells.
a The ROS levels of C2C12 cells during differentiation as measured by dichlorofluorescein (DCF). Data are presented as mean ± s.d. (n = 3 independent experiments). b C2C12 cells were harvested for cysteine sulfenic acid detection at indicated differentiation days. c WT C2C12 cells treated without or with NAC at indicated differentiation days were harvested for immunoblotting analysis. d WT and Insig-2-KO C2C12 cells at indicated differentiation days were harvested for immunoblotting analysis. e The mRNA levels of indicated genes in the undifferentiated and differentiated C2C12 cells (n = 2 biologically independent samples per condition, bars in black). Data are presented as mean ± s.d. *p < 0.05, **p < 0.01, ***p < 0.001. ns not significant, two-way ANOVA followed by Bonferroni’s post hoc analysis. f Oil Red O staining, Scale bar, 20 μm. g Quantification of the lipid droplets of the cells in (f) (n = 3 biologically independent experiments). Data are presented as mean ± s.d. Asterisks indicate the differences of oil red O staining in WT (bars in black) or Insig-2-KO C2C12 cells (bars in red) between Differentiation Day 0 (undifferentiated) and 6, ****p < 0.0001; hash symbols indicate the differences of oil red O staining in WT and Insig-2-KO C2C12 cells at Differentiation Day 6, ####p < 0.0001, two-way ANOVA followed by Bonferroni’s post hoc analysis. h Schematic showing glucose metabolism in the skeleton muscle. The oxidation of C215 by ROS generated as side products during oxidative phosphorylation (OXPHOS) process stabilizes Insig-2, inhibiting lipid biosynthesis by blocking the SREBP pathway and helping to channel the carbon flux mainly to ATP generation.

