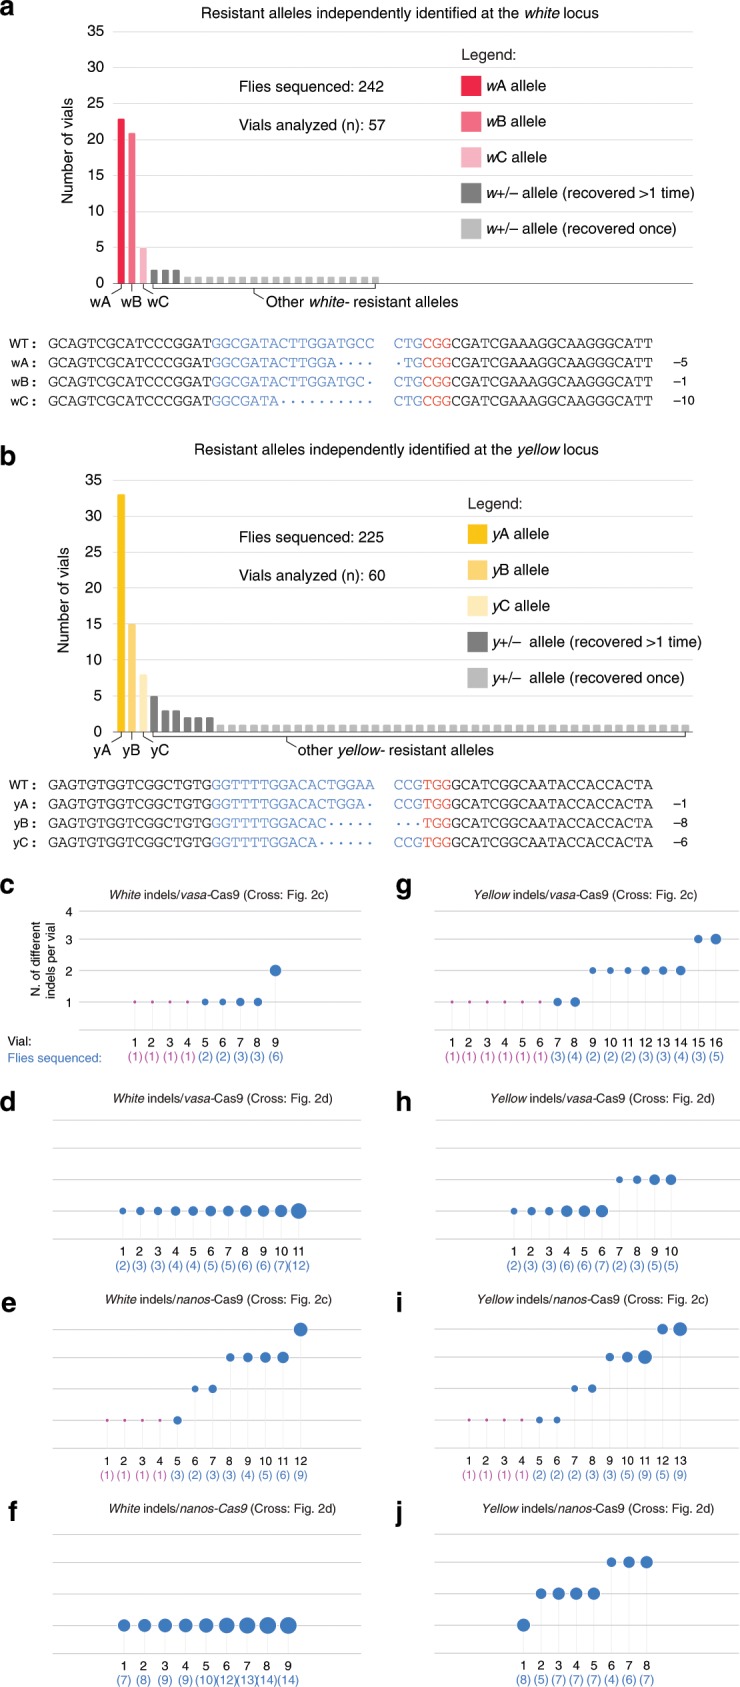
Fig. 3. Analysis of resistant allele formation in the tGD(y,w) configuration.

a, b Graphs represent the independent generation of specific indel mutations generated in the experiments carried out in Fig. 2 and Fig. S3 when allelic conversion failed at the (a) white and (b) yellow loci. At both loci, we observe three repeatedly isolated indels that are colored with different shades of red for the white locus (wA, wB, and wC, dark, medium, and light red, respectively) and yellow for the yellow locus (yA, yB, and yC, dark, medium, and light yellow, respectively), the sequence of which is reported under each graph indicating with dots the missing bases compared with the wild-type sequence, split at the expected cut site. Additional indels recovered more than once are colored in dark gray, and those recovered only once are colored in light gray. a, b Legends describing symbolism are overlaid on each of the two graphs. c–j Each panel depicts the number of different indels recovered (y-axis) in ascending order for each F1 female (numbered on x-axis) for which the F2 male progeny was sampled. Blue bubble size indicates the number of flies analyzed for each specific F1 female, which is also reported under the vial number in parenthesis. For F1 females producing only one F2 male with an indel, and therefore only one male was sampled, the bubble is represented in magenta instead of blue.
