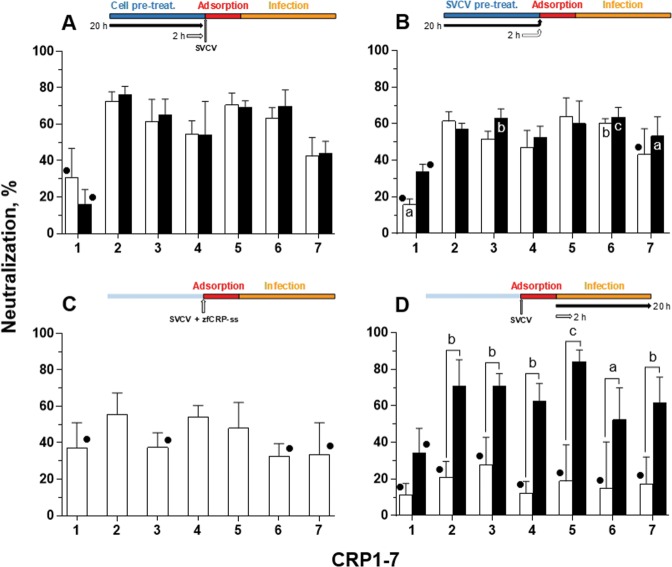
Figure 1.
Effect of CRP treatment on SVCV replication in EPC cells. The neutralization activity of CRP1-7 was analysed by adding each CRP at different points of SVCV replication by incubating the CRP with (A) EPC cells before virus adsorption, (B) SVCV before and during virus adsorption, (C) both EPC cells and SVCV only during virus adsorption and (D) infected EPC cells (i.e., after adsorption). The duration of incubations was either 2 h (white bars) or 20 h (black bars). Descriptions of the experimental timeline charts are included as insets at the top of each corresponding graph. SVCV infection was determined by the focus forming assay. The data are expressed as percentages of neutralization. Graphs represent the mean and s.d. of three independent experiments, each performed in triplicate. • Indicates no significant differences between the treatment and the control (GFP treatment). The significant differences determined as P < 0.05, P < 0.01 and P < 0.001 were indicated as a, b or c, respectively. Inside-bar symbols from graph (B) indicate significant differences in comparison to corresponding CRP treatments in (C). Statistically significant differences between different times within the same CRP treatment are shown with symbols over the keys connecting both groups. Data were analysed by using two-way ANOVA with Sidak’s multiple comparisons test.

