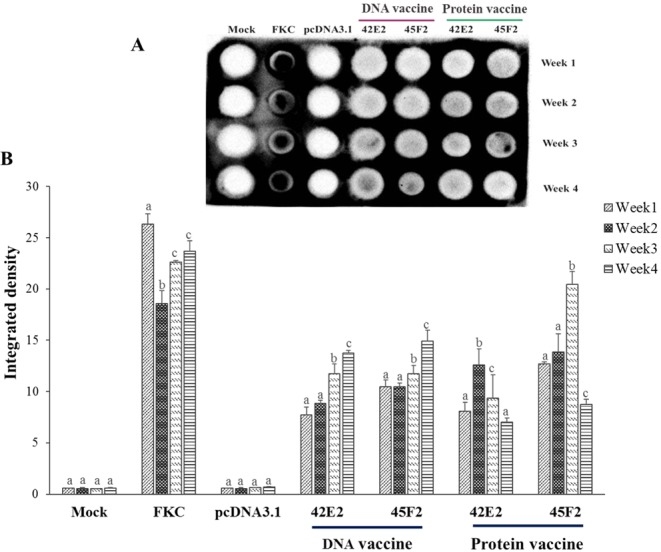
Figure 7.

Dot blot analysis of serum from vaccinated fish. (A) The detectable antibody from vaccinated fish serum is shown on the membrane compared with that for the mock, FKC (formalin killed cell) and pcDNA3.1 group (negative control) against recombinant protein of multiepitope vaccine themselves of FKC vaccine at 1 month. (B) The integrated density from all the dot blot results were converted to the values using the ImageJ 1.x server. Data are represented as the means ± SDs (n = 2). The different letters above the bars indicate significant differences within treatment (P < 0.05).
