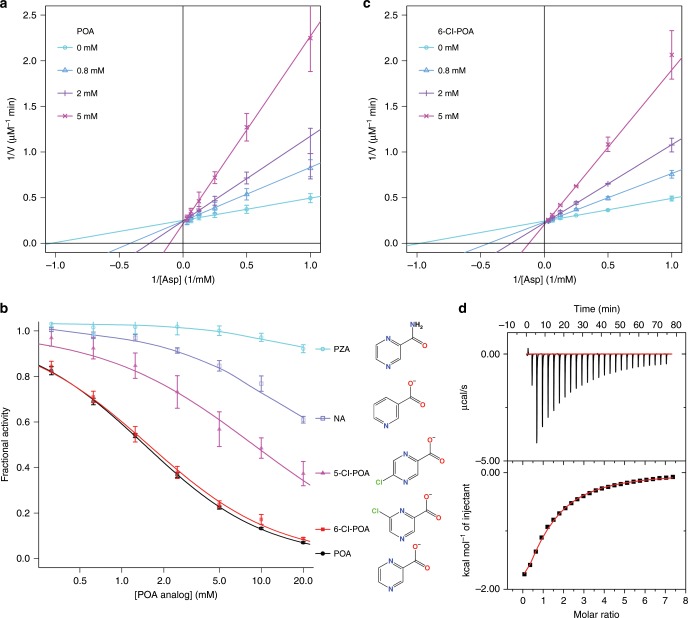
Fig. 1. Biochemical characterization of the interaction between Mtb PanD and POA.
a POA showed competitive inhibition of Mtb PanD. Lineweaver–Burk plots of Mtb PanD activity in the presence of various concentrations of POA prepared in triplicate. The data were fitted with a competitive inhibition model, yielding Ki = 0.78 (0.05) mM, KM = 1.08 (0.06) mM, and kcat = 0.330 (0.006) s−1. b Inhibition of PanD activity with POA analogs. Dose–response curves were measured using the described PanD assay with pyrazinamide (PZA), nicotinic acid (NA), 5-Cl-POA, 6-Cl-POA, and POA. There were six replicates. c 6-Cl-POA inhibits Mtb PanD comparatively to POA. The plot was indicative of a competitive model of inhibition with Ki = 1.00 (0.04) mM, KM = 1.12 (0.04 mM), and kcat = 0.350 (0.003) s−1. d Isotherm calorimetry of Mtb PanD with POA. The top panel shows the heat released per injection of inhibitor, as µcal s−1; while the bottom panel shows the change in enthalpy (kcal mole−1) as a function of the molar ratio of POA to PanD. Titrations were performed at 20 °C using 100 mM Tris buffer (pH 7.5) for both the protein solution and POA titrant. The data were fitted with a single-site binding model. From five separate experiments, it was calculated that Kd = 0.71 (0.03) mM, ΔH = −4200 (200) cal mol−1, ΔS = 0.1 (0.7) cal mol−1 deg−1. Error bars were defined as standard deviations. Source data are provided as a Source Data file.

