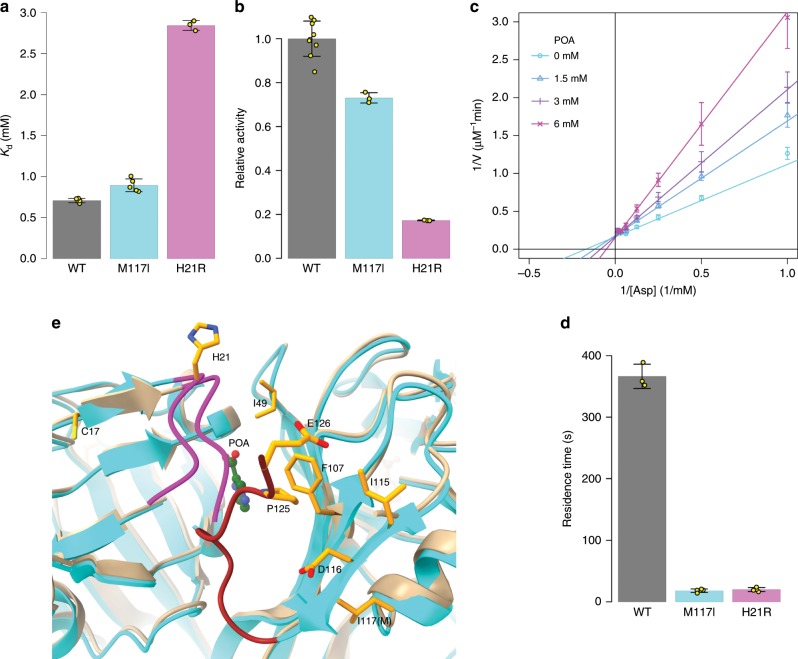
Fig. 3. POAr mutations on Mtb PanD.
a H21R showed resistance to POA. Lineweaver–Burk plots of H21R activity in the presence of various concentrations of POA prepared separately in quadruplicate. The data were fitted with a competitive inhibition model, yielding Ki = 3.0 (0.1) mM, KM = 5.5 (0.2) mM, and kcat = 0.184 (0.003) s−1. b The relative enzyme activity of Mtb PanD proteins. The aspartate concentration was 1 mM in the assay. c The affinity of Mtb PanD:POA was measured with ITC. POA at 40 mM was titrated into 0.5 mM H21R PanD, while 20 mM POA was used in the wild type and M117I experiments. d Residence time of POA–panD measured with BLI. e Mapping of POAr sites on M117I and wild-type PanD:POA structures. A ribbon structure of the M117I mutant colored in cyan is superimposed on to the wild-type PanD ribbon in tan. Side chains of the reported resistant mutants mapped to the M117I structure are shown in orange. POA is shown in green. The β-chain C-terminal loop Leu20-Gly24 is highlighted in magenta, while the α-chain loop His119-Glu126 is in brown. Error bars were defined as standard deviations. Source data are provided as a Source Data file.

