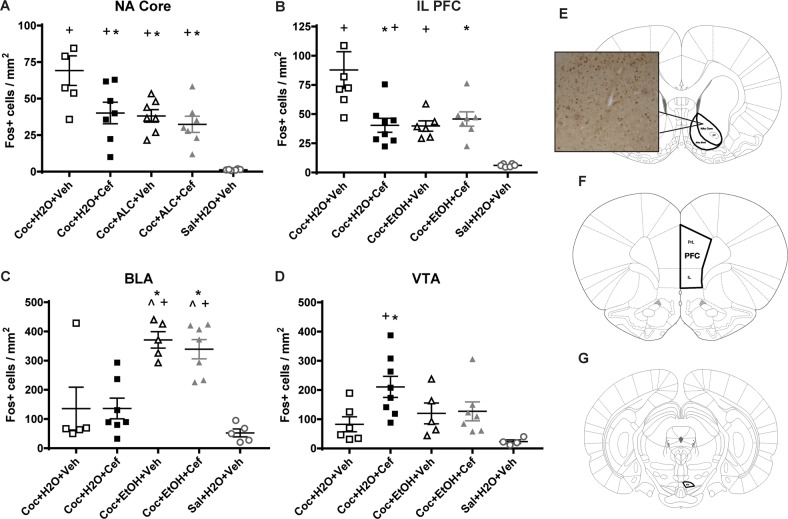
Fig. 4.
Reinstatement-induced Fos expression was influenced by prior exposure to alcohol and ceftriaxone. In the NA core (a) and Infralimbic (IL) PFC (b), all groups showed more Fos expression than the Sal + H2O + Veh group and the Coc + H2O + Veh group showed more Fos than all other cocaine groups. c In the BLA, both alcohol-consuming groups displayed greater Fos expression than both cocaine and water-consuming groups as well as the Sal + H2O + Veh group. d The Coc + H2O + Cef group displayed greater Fos expression in the VTA than the Coc + H2O + Veh and the Sal + H2O + Veh groups. * = p < 0.05 vs. Coc + H2O + Veh; + = p < 0.05 vs. Sal + H2O + Veh. ^ = p < 0.05 compared to Coc + Cef + Veh. The number of rats per group ranges from 5–8 due to damage to tissue during immunohistochemistry. e Fos analysis sites in the NA core and shell, PFC (f), and VTA (g)

