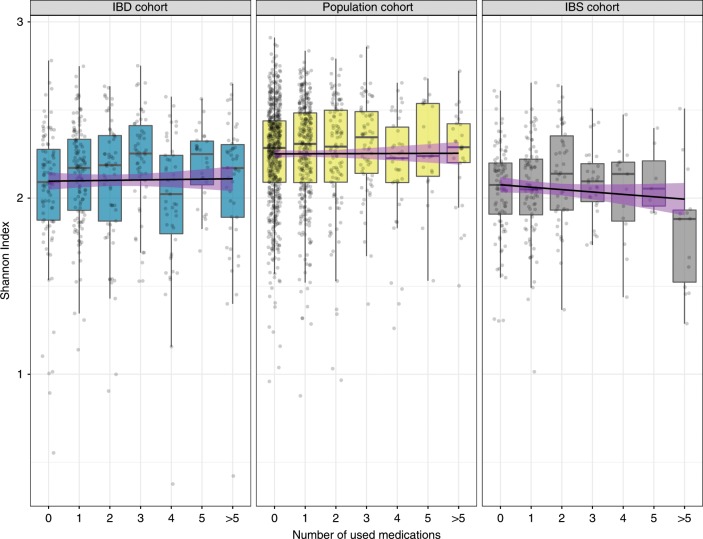
Fig. 1. Microbial richness (Shannon index) for each participant stratified per number of medications used.
Dots represent the richness value per each sample in the study. Boxplot shows the median and interquartile range (25th and 75th). Whiskers show the 1.5*IQR range. Black lines show linear regression with a purple shadow indicating the 95% confidence interval. From left to right, the IBD cohort (N = 454 samples, linear regression, coefficient = −0,001, p = 0.88), population cohort (N = 1124 samples, linear regression, coefficient = −0.002, p = 0.77) and the IBS cohort (N = 305 samples, linear regression, coefficient = −0.016, p = 0.06). (Source data are provided as a Source Data file).

