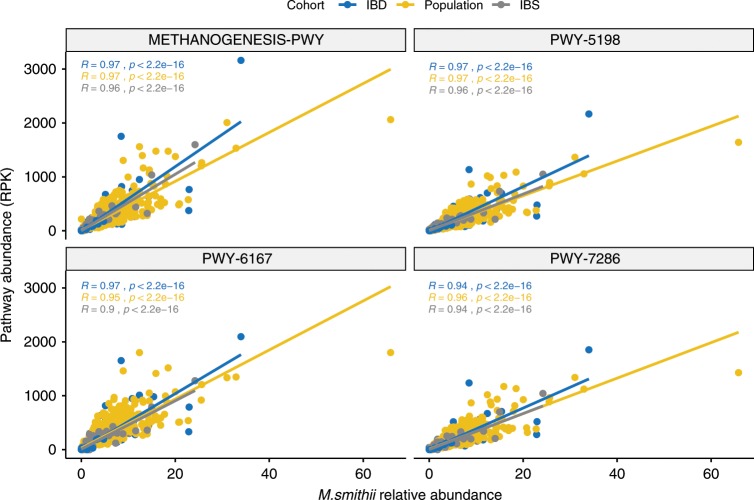
Fig. 3. Correlation between the relative abundance of Methanobrevibacter smithii and the pathways associated with oral steroids.
Dots are coloured by study cohort. In blue the cohort of IBD patients, in yellow the population cohort and in grey the IBS case-control cohort. X-axis represents the relative abundance of Methanobrevibacter smithii and Y-axis the read per kilobase (RPK) of each pathway. Spearman correlation was used to calculate the correlation and significance. (Source data are provided as a Source Data file).

