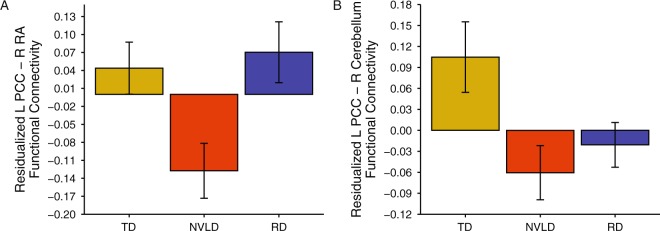
Figure 2.
Group Differences in Spatial Network Connectivity. Displays differences in spatial network connectivity across the typically developing (TD) children, children with reading disorder (RD), and children with nonverbal learning disability (NVLD). (A) Shows a group difference in residualized connectivity between left posterior cingulate cortex (PCC) and the right retrolimbic area (RA). (B) Shows a group difference in residualized connectivity between left PCC and right cerebellum. Bars indicate mean connectivity values (Fisher r-to-Z transformed correlation values) residualized for age, sex, and mean motion; error bars indicate the standard error of the mean.

