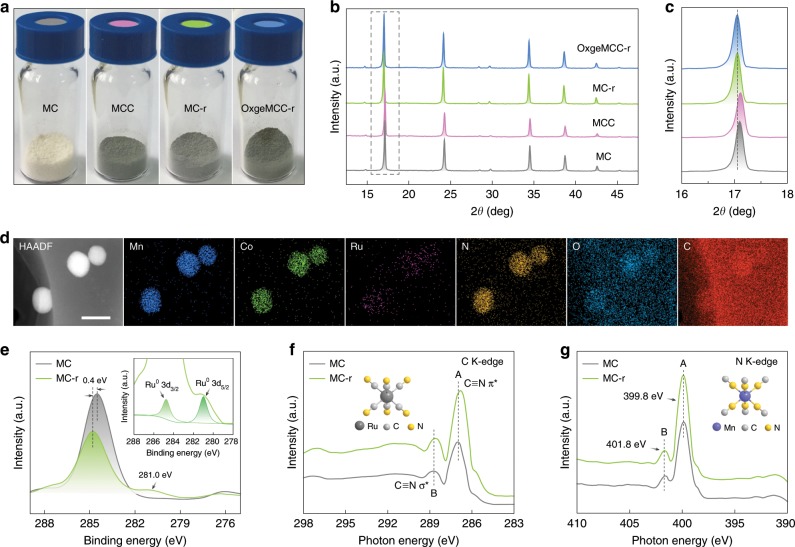
Fig. 3. Structure characterizations.
a Photograph of MC, MCC, MC-r, and OxgeMCC-r SAE. b Powder XRD of corresponding materials. c Enlarged powder XRD (2θ from 16 to 18 degree) of b. d HAADF-STEM image and corresponding EDS elemental mapping (Mn, Co, Ru, N, O, and C elements) of OxgeMCC-r SAEs. Scale bar is 100 nm. e C 1s XPS spectrum magnified from Supplementary Figs. 1 and 3. Inset is the enlarged Ru 3d spectrum of MC-r. f C K-edge NEXAFS spectra of MC and MC-r. g N K-edge NEXAFS spectra of MC and MC-r.

