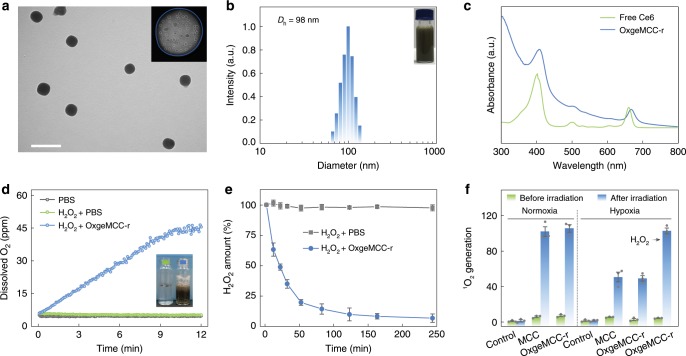
Fig. 4. Structure, oxygen generation, and singlet oxygen generation of OxgeMCC-r SAE.
a Representative TEM image. Inset is the enlarged image of one single OxgeMCC-r SAE after reversed-phase treatment. White dotted circles indicate the encapsulated Ce6. Scale bar is 200 nm. b DLS profile with the inset picture of the sample dispersed in water. c UV-vis absorption spectra of free Ce6 and OxgeMCC-r SAE. d O2 generation after treating OxgeMCC-r SAE with H2O2 in PBS. Inset is a photograph of H2O2 solutions in the presence or absence of OxgeMCC-r SAE. e Degradation profiles of H2O2 with or without of OxgeMCC-r SAE. f Singlet oxygen (1O2) generation ability determined by DPBF indicator under different conditions before and after laser irradiation (671 nm, 100 mW cm−2, 30 s). Data are presented as mean ± s.e.m. (n = 3).

