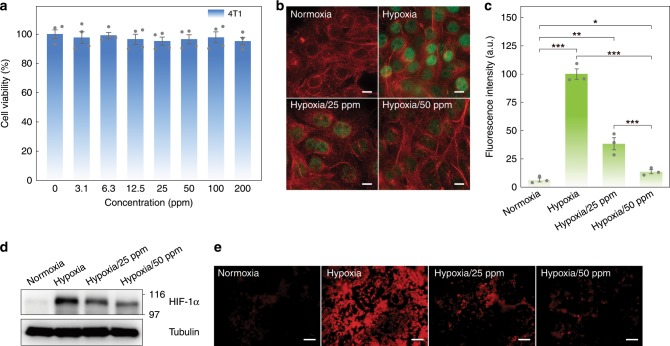
Fig. 5. In vitro biocompatibility, alleviation of hypoxic condition, and intracellular O2 generation.
a 4T1 cells viability after treated with MC-r nanoparticles with different concentrations. Data are presented as mean ± s.e.m. (n = 4). b Fluorescence imaging of 4T1 cells with stained HIF-1α (green) and tubulin (red) after treated with PBS under normoxic condition (21% O2, 5% CO2, and 74% N2) as well as PBS (Hypoxia) and MC-r (Hypoxia/25 ppm and Hypoxia/50 ppm) under hypoxic condition (1% O2, 5% CO2, and 94% N2). Scale bar is 10 µm. c Relative intensity of corresponding green fluorescence from HIF-1α under different treating conditions. Data are presented as mean ± s.e.m. (n = 3). Statistical analysis was performed via one-way ANOVA. *p < 0.05, **p < 0.01, ***p < 0.001. d Western blot analysis of HIF-1α expression in 4T1 cells under different treating conditions. e Fluorescence imaging of 4T1 cells stained by O2 indicator after treatments with different conditions. Scale bar is 100 µm.

