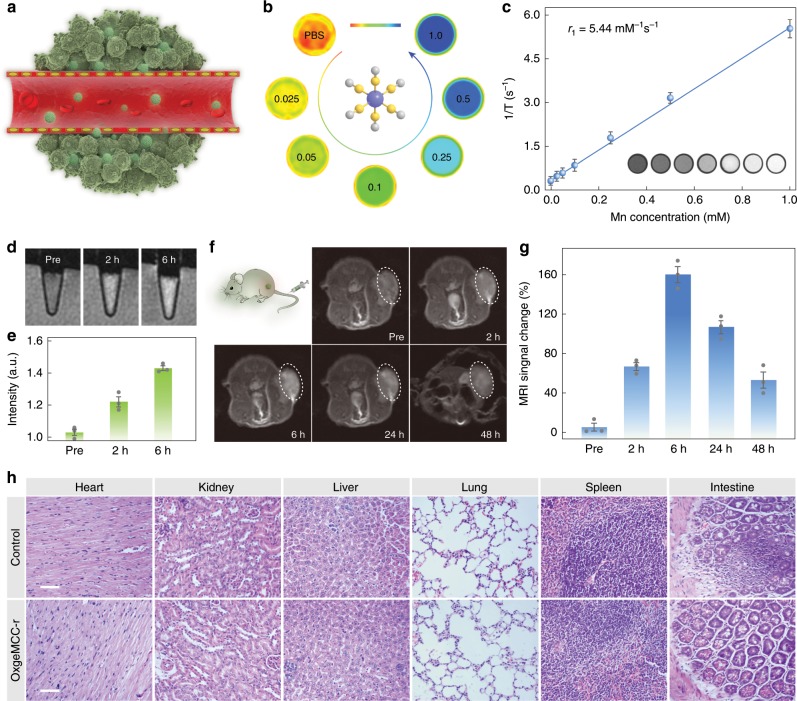
Fig. 7. In vitro/vivo MR imaging and biocompatibility of OxgeMCC-r SAE.
a Accumulation of OxgeMCC-r SAE at the tumor site through the EPR effect. b In vitro T1-weighted magnetic resonance images of OxgeMCC-r SAE in aqueous solution with various Mn concentrations (mM). c Transverse relativity (r1) value of 5.44 mM−1 s−1 for OxgeMCC-r SAE. Inset is magnetic resonance phantom images of OxgeMCC-r SAE. Data are presented as mean ± s.e.m. (n = 3). d T1-weighted MR imaging of 4T1 cells treated with PBS, OxgeMCC-r SAE for 2 h, and OxgeMCC-r SAE for 6 h. e Corresponding relative MR imaging intensity of (d). Data are presented as mean ± s.e.m. (n = 3). f In vivo T1-weighted magnetic resonance images of 4T1 tumor-bearing mouse at various time points post-injection. Tumor regions are marked with white dashed lines. g Quantitative T1-weighted MR imaging signals within the tumor site. Data are presented as mean ± s.e.m. (n = 3). h Micrographs of major organs stained with H&E. Scale bar is 50 µm.

