
Figure 2.
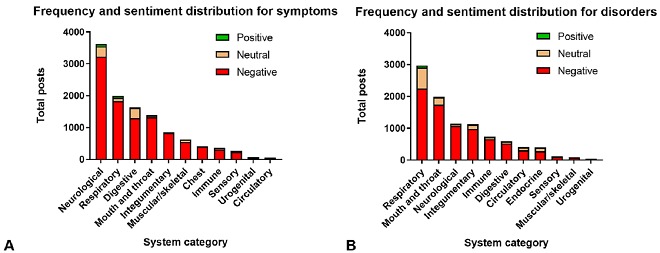
Frequency distribution of reported symptom (A) and disorder (B) posts grouped into their systems or anatomical regions. The frequency of positive, neutral, and negative posts is shown for symptoms (A) and for disorders (B).
Official websites use .gov
A
.gov website belongs to an official
government organization in the United States.
Secure .gov websites use HTTPS
A lock (
) or https:// means you've safely
connected to the .gov website. Share sensitive
information only on official, secure websites.
Frequency distribution of reported symptom (A) and disorder (B) posts grouped into their systems or anatomical regions. The frequency of positive, neutral, and negative posts is shown for symptoms (A) and for disorders (B).