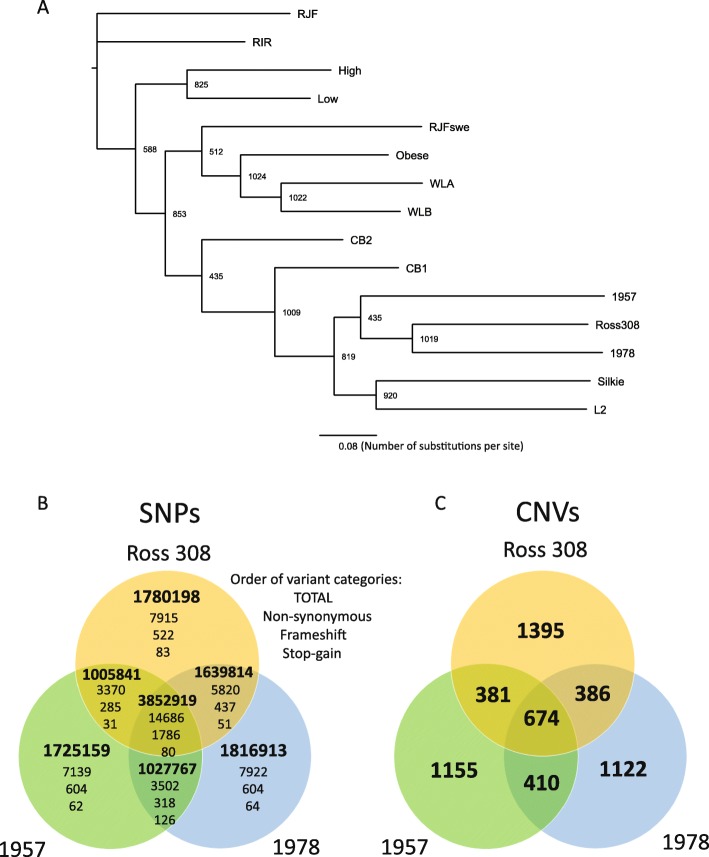
Fig. 1.
Overview of variant results following SNP and CNV calling. a Phylogenetic analysis of chicken lines. The phylogenetic tree was reconstructed using PhyML with 1024 bootstrap replicates. Bootstrap values are indicated at the branch points, the scale bar indicates number of nucleotide substitutions per site. Red Jungle Fowl was used to root the tree. Only SNPs identified in at least one Illumina-sequenced and two SOLiD sequenced datasets and occuring within genomic regions covered by more than 5 reads in all SOLiD datasets and more than 10 reads in all Illumina datasets were used in the analysis. b and c Venn diagrams displaying the number of SNPs (b) and CNVs (c) that are unique and shared between the three genomes sequenced in this study.

