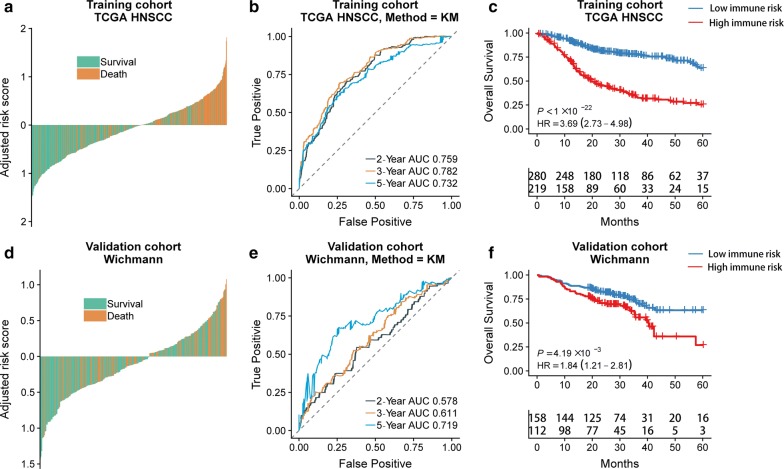
Fig. 2.
The outcomes of low and high immune risks in HNSCC patients. The overall survival rate of patients in the different immune risk groups of training cohort (a) and validation cohort (d). Kaplan–Meier curves comparing patients with low or high immune risk in training cohort (b) and validation cohort (e). IRGS significantly stratified HNSCC patients into low immune risk and high immune risk groups in regard to the overall survival in the training cohort (HR = 3.69, 95% CI 2.73–4.98, P < 0.001) (c), the validation cohort (HR = 1.84, 95% CI 1.21–2.81, P < 0.01) (f). P-values were calculated using log-rank tests and HR is short for hazard ratio

