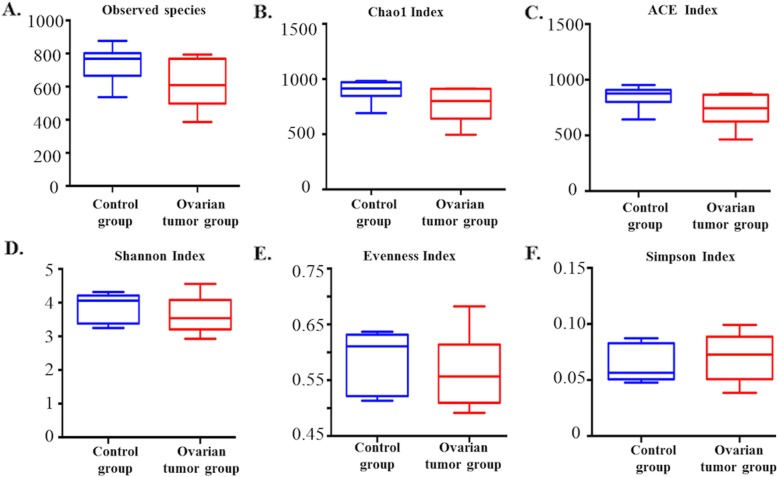
Fig. 2.
Bacterial richness and diversity in the cancer and control groups revealed by 16S rRNA sequencing a Observed species index (P = 0.06, Mann-Whitney U test); b Chao 1 index (P = 0.06, Mann-Whitney U test); c ACE index (P = 0.06, Mann-Whitney U test); d Shannon index (P = 0.32, Mann-Whitney U test); e Evenness index (P = 0.48, Mann-Whitney U test); f Simpson index (P = 0.46, Mann-Whitney U test)

