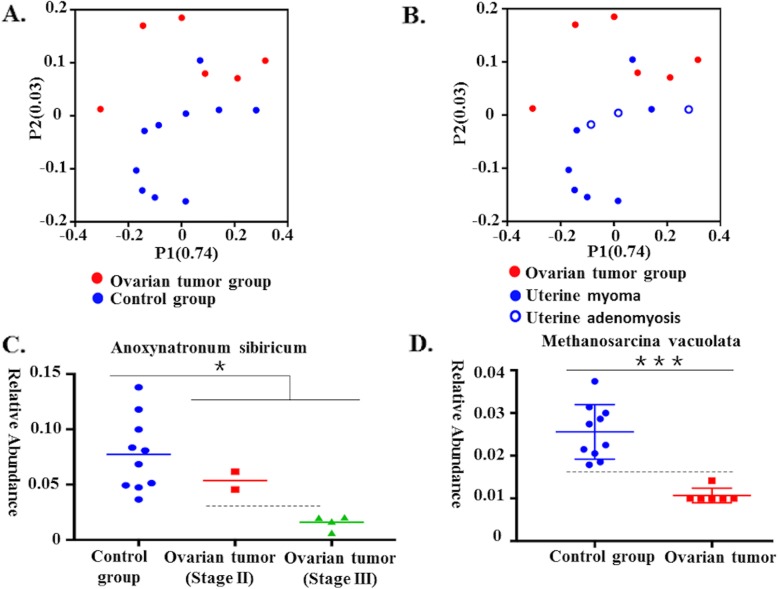
Fig. 4.
Communities clustered using PCoA and the relative abundance of Anoxynatronum sibiricum and Methanosarcina vacuolata. a Communities were clustered using PCoA. PC1 and PC2 are plotted on the x and y axes. The red block is equal to a sample in the ovarian cancer group. The blue circle is equal to a sample in the control group. The samples from the ovarian cancer group can be separated from other samples in the control group. b Communities clustered using Principal Component Analysis (PCoA). PC1 and PC2 are plotted on the x and y axes. The red block is equal to a sample in the ovarian cancer group. The blue solid circle is equal to a sample from a patient with uterine myoma, and the blue hollow circle is equal to a sample of a patient with uterine adenomyosis. c The relative abundance of Anoxynatronum sibiricum (Control group: n = 10, cancer group: n = 6, P = 0.034, Mann-Whitney U test). d The relative abundance of Methanosarcina vacuolata (Control group: n = 10, cancer group: n = 6, P = 0.001, Mann-Whitney U test)

