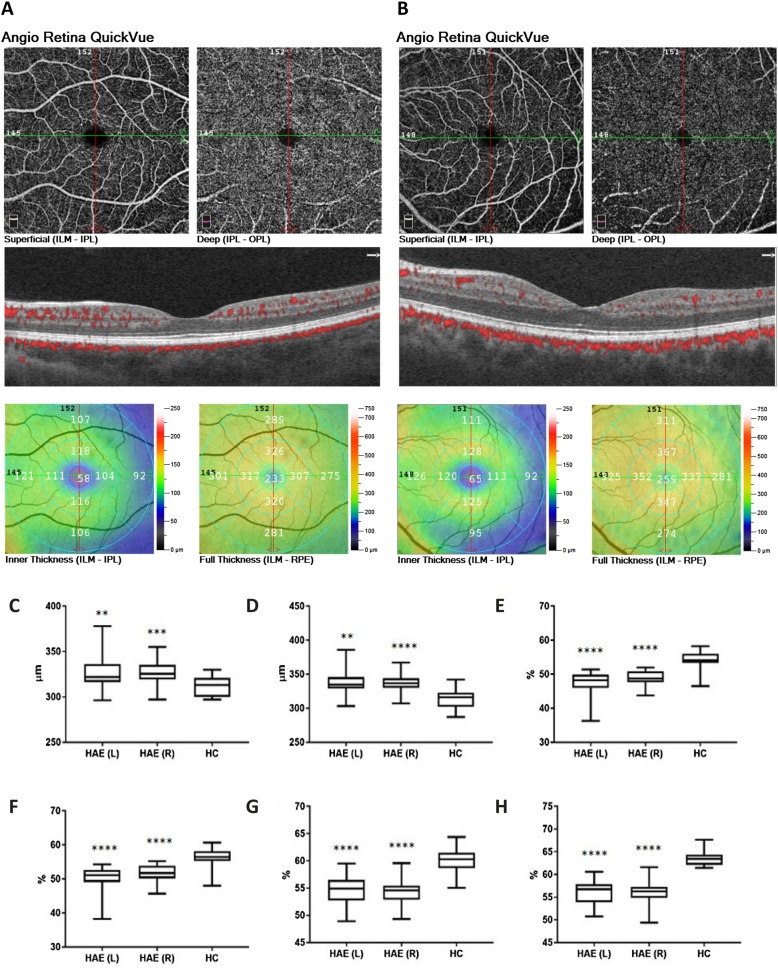
Fig. 1.
Retinal imaging by optical coherence tomography angiography. Optical coherence tomography angiography (OCT-A) generated en face 6 × 6-mm angiograms of superficial and deep retinal capillary plexi: representative scans from the left eye of a healthy control (HC) and a patient with type I hereditary angioedema (HAE) were reported in panels (a and b), respectively. Color-coded topographic maps described corresponding thicknesses with quantitative data. HAE patients showed higher retinal thickness at whole image scan (panel c, left P = 0.006; right P = 0.0008) and at the parafoveal area (panel d, left P = 0.006; right P < 0.0001) than controls. Superficial and deep retinal capillary density at whole image (panel e and g, respectively) and at the parafoveal area (panel f and h, respectively) was lower in HAE patient than in control with P < 0.0001 for all the comparisons between HAE and HC. Data are reported as box and whisker plots with median, lower as well as upper extreme. Significant differences were tested using the Mann–Whitney U test. P < 0.05 was considered statistically significant. (** P < 0.01, *** P < 0.001, **** P < 0.0001 with respect to control eyes). L, left eyes; R, right eyes; ILM, inner limiting membrane; IPL, inner plexiform layer; OPL, outer plexiform layer; RPE, retinal pigment epithelium

