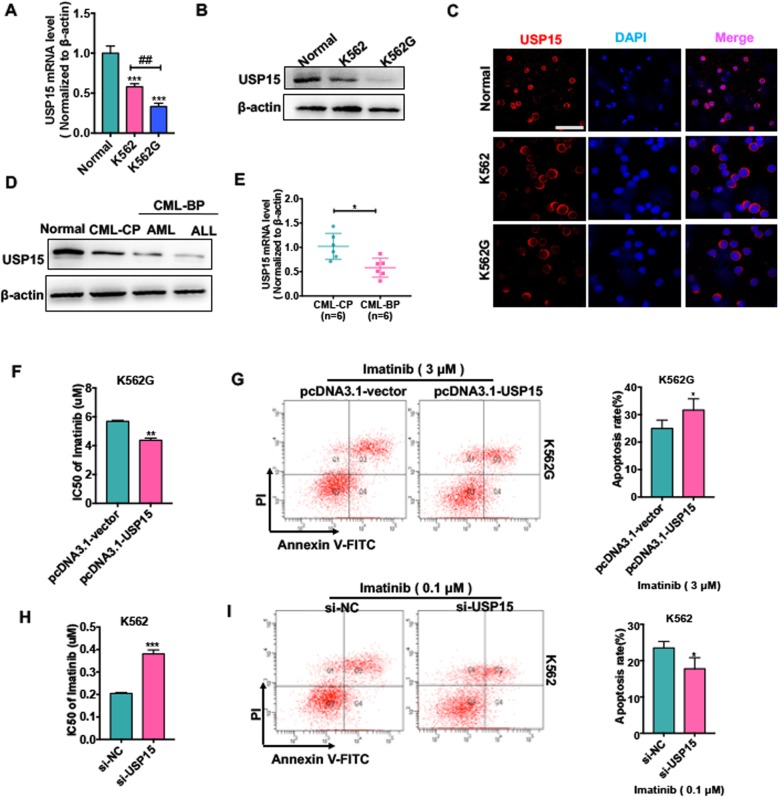
Fig. 2.
Downregulation of USP15 contributes to Imatinib resistance of CML cells. (a) qRT-PCR was used to detect USP15 mRNA level in K562 cells, K562G cells and PBMCs of healthy donors. *** P < 0.001 vs normal; ## P < 0.01 vs. K562 cell. (b) Western blot analysis was used to evaluate USP15 protein level in K562 cells, K562G cells and PBMCs of healthy donor. (c) Immunofluorescence analyzed the USP15 protein level and the localization of USP15 in K562 cells, K562G cells and PBMCs of healthy donor. Scale bar = 64 μm. (d) Western blot analysis was used to evaluate USP15 protein level in different phases of CML (CML-CP, CML-BP-AML, CML-BP-ALL) patients’ PBMCs compared with the PBMCs of normal donors. (e) qRT-PCR was used to test USP15 mRNA level in PBMCs of CML-CP (n = 6) patients and PBMCs of CML-BP patients (n = 6). *P < 0.05 vs. CML-CP. (f) K562G cells were transfected with pcDNA3.1-USP15 or empty and then treated with Imatinib in different concentrations for 48 h. Imatinib IC50 was evaluated by CCK-8 assay. **P < 0.01 vs. pcDNA3.1-vector. (g) K562G cells were transfected with pcDNA3.1-USP15 or empty vector and then treated with Imatinib (3 μm) for 48 h. Cell apoptosis was evaluated by Annexin V-FITC/PI staining. Right panel shows the analysis of apoptosis rate. *P < 0.05 vs. pcDNA3.1-vector. (h) K562 cells were transfected with si-USP15 or si-NC and then treated Imatinib in different concentrations for 48 h. Imatinib IC50 was evaluated by CCK-8 assay. ***P < 0.001 vs. si-NC. (i) K562 cells were transfected with si-USP15 or si-NC and then treated with Imatinib (0.1 μm) for 48 h. Cell apoptosis were evaluated by Annexin V-FITC/PI staining. *P < 0.05 vs si-NC

