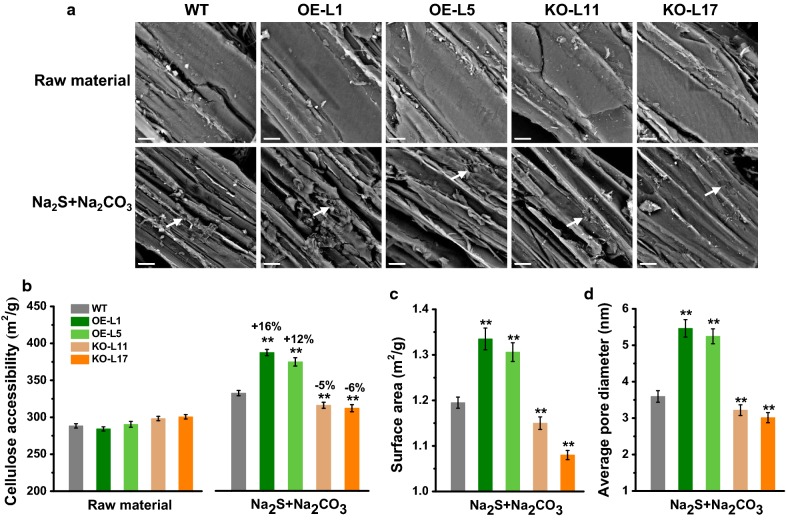
Fig. 7.
Characterization of biomass porosity and cellulose accessibility in the transgenic lines and WT. a SEM images of raw material and biomass residue obtained from green liquor (Na2S + Na2CO3) pretreatment. Scale bar is 10 μm. Allows as rough point. b Cellulose accessibility by measuring Congo red (CR) dye area. c, d Surface area and average pore diameter of biomass residues obtained from green liquor (Na2S + Na2CO3) pretreatment. All data as mean ± SD of three technical replicates. Student’s t test was performed between the transgenic plants and WT as **P < 0.01

