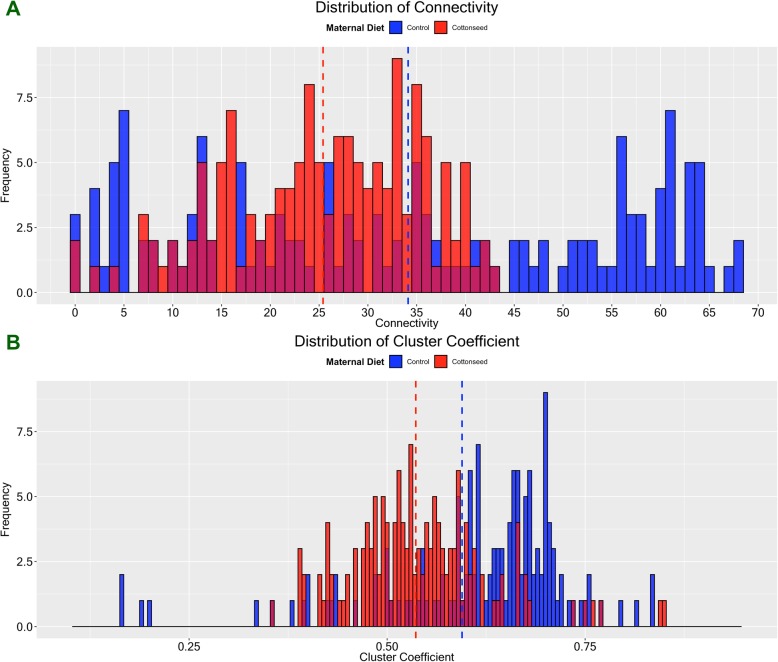
Fig. 4.
Spermatogenesis coexpression network analysis: distributions of node connectivity and node clustering coefficient between maternal diets. a Node connectivity; (b) Node clustering coefficient. Control diet is represented in blue while gossypol-rich cottonseed diet is represented in red. Treatment means are marked by the dashed vertical lines: the blue line is for the control diet and the red line is for the gossypol-rich cottonseed diet

