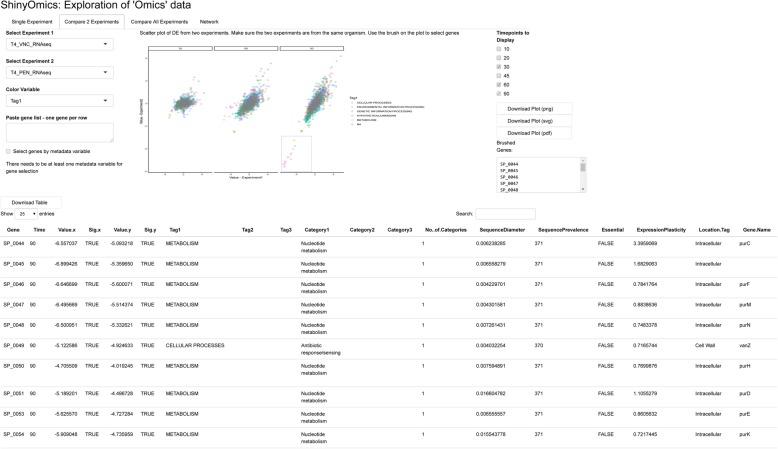
Fig. 2.
Comparison of 2 experiments. On the left are selectors for the two experiments to be compared, and a color variable. Here, DE from vancomycin (VNC) and the penicillin (PEN) are being compared for T4. Blue box on the plot indicates a set of brushed points. The table below the plot (cropped) displays all available information regarding the brushed points

