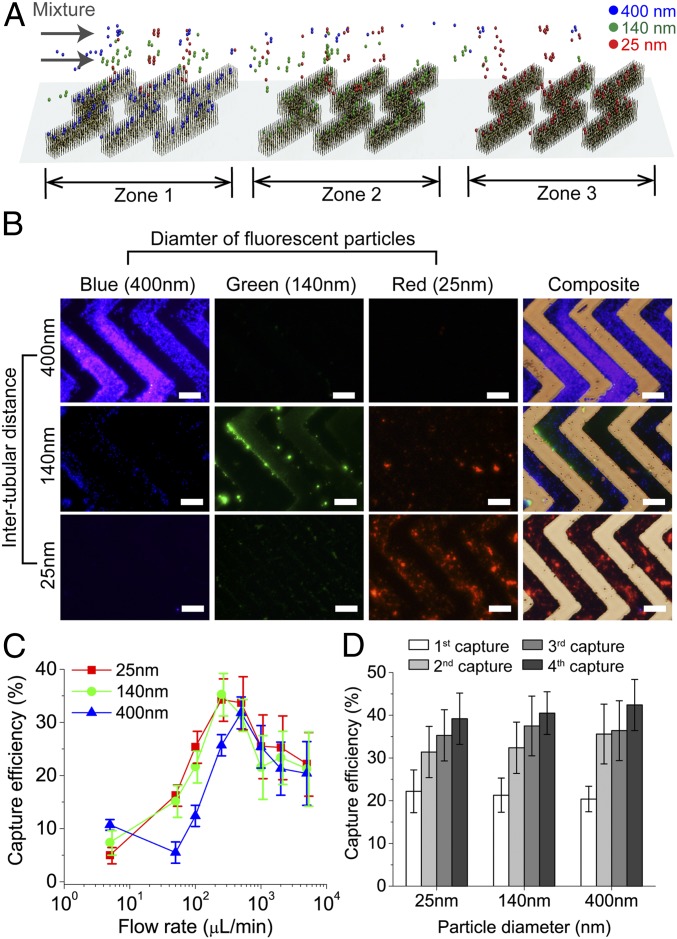
Fig. 3.
Characterization of size-based capture. (A) Illustration of capture and separation of 3 different sizes of fluorescently labeled silica particles by VIRRION with 3 zones of ITDs. (B) Fluorescent and combined bright-field images of particles captured and separated by VIRRION into individual zones. (Scale bar: 200 µm.) (C) Capture efficiency of different silica particles captured by VIRRIONS under different flow rates. (D) Capture efficiency of silica particles after multiple repeated capture by the same VIRRION.

