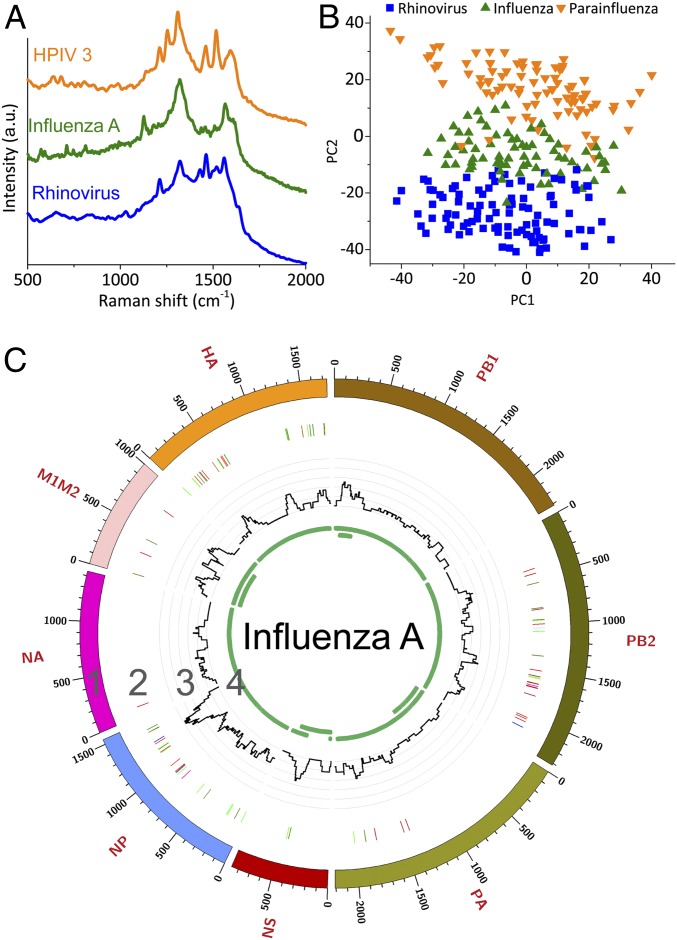
Fig. 5.
VIRRION testing of respiratory viruses. (A) Raman spectra. (B) PCA plot of Raman fingerprint of the different viruses. Each dot represents a collected spectrum. (C) Circos plots of coverage and variants of captured influenza viruses. Genome segment sequencing and analysis of influenza A mapped to strain A/New York/03/2016 (H3N2). Track 1: scale of the base pair position; track 2: variant analysis by mapping to strain H3N2 (KX413814–KX413821), color code: deletion (black), transition (A–G, fluorescent green; G–A, dark green; C–T, dark red; T–C, light red), transversion (A–C, brown; C–A, purple; A–T, dark blue; T–A, fluorescent blue; G–T, dark orange; T–G, violet; C–G, yellow; G–C, light violet); track 3: coverage; track 4: regions of ORF.

