Fig. 4.
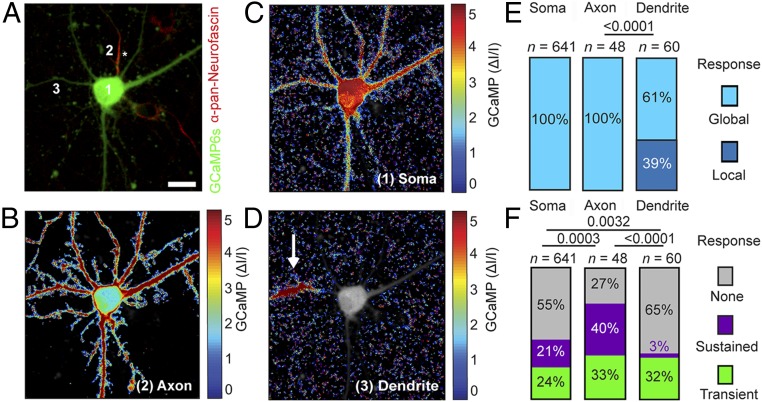
Mechanical stimulation of axon, dendrite, and soma reveals differential responses. (A) Cortical neuron expressing GCaMP6S (green) and stained with anti–pan-neurofascin (red) to identify the axon. (B–D) Normalized fluorescence intensity heat maps showing averaged calcium responses to a 250-ms mechanical indentation of axon (B), soma (C), and dendrite (D). The locations of the mechanical stimuli are indicated by numbers 1–3 in A. Dendrite stimulation shows local calcium responses (white arrow); soma and axon stimulations show a global calcium response. The axon is marked by an asterisk. (Scale bar: 10 µm.) (E and F) Response types of cortical neurons to mechanical indentation of soma, axon, or dendrite. (E) Percentage of neurons showing local (dark blue) and global (light blue) responses. (F) Percentages of neurons showing no response (gray), sustained response (purple), and transient response (green). n represents the number of neurons analyzed. The χ2 test was used for statistical analysis.

