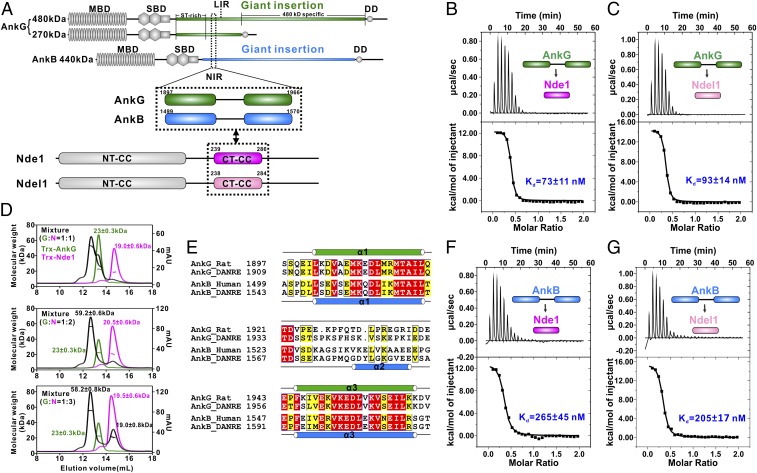
Fig. 1.
The giant insertions of AnkG and AnkB bind strongly to Ndel1/Nde1 at a 1:2 molar ratio. (A) Schematic diagram showing the domain organizations of 270/480-kDa AnkG and 440-kDa AnkB, Nde1, and Ndel1, as well as the location of the NIR sequences in AnkG/AnkB. In this drawing, the AnkG/AnkB and Nde1/Ndel1 interactions are further highlighted and indicated by 2-way arrows. MBD, membrane-binding domain; SBD, spectrin-binding domain; DD, death domain. (B and C) ITC-based measurements of the binding affinity of the AnkG-NIR with Nde1 CT-CC (B) or Ndel1 CT-CC (C). The Kd error is the fitting error obtained using a 1-site binding kinetics model to fit the ITC data. The ITC-measured N value, which is related to the binding stoichiometry, indicates that the binding stoichiometry of AnkG-NIR with Ndel CT-CC/Ndel1 CT-CC interaction is 1:2. (D) Analytical gel filtration chromatography analysis coupled with static light scattering analysis of Trx-AnkG-NIR (green line), Trx-Nde1 CT-CC (pink line), and the Trx-AnkG-NIR/Trx-Nde1 CT-CC complex (black line), indicating that AnkG-NIR and Nde1 CT-CC form a stable 1:2 complex in solution. (E) Sequence alignment of the NIRs from AnkG and AnkB. Residues that are identical and highly similar are indicated in red and yellow boxes, respectively. The secondary structure elements are labeled according to the crystal structure of the AnkB/Ndel1 complex and the NMR data of the AnkG/Nde1 complex. (F and G) ITC-based measurement of the binding affinity of AnkB-NIR with Ndel CT-CC (F) and with Ndel1CT-CC (G).

