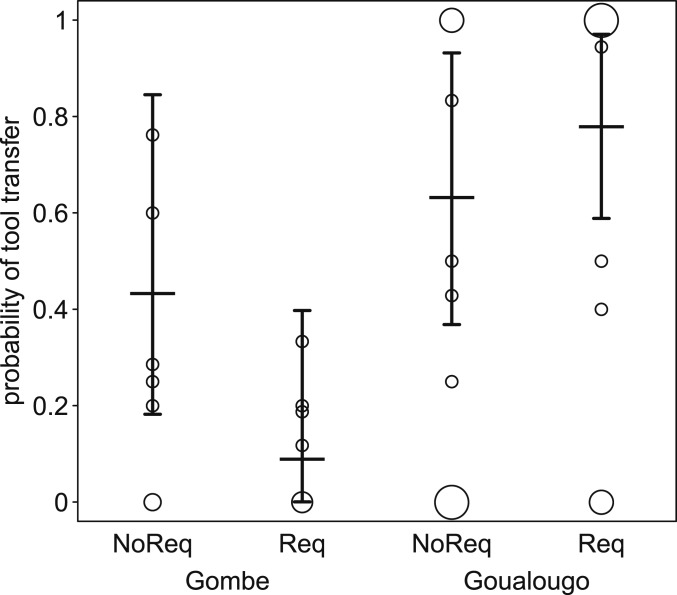
Fig. 2.
Tool-transfer probability and how it depended on tool request status and population. Indicated are the fitted model and its confidence limits (horizontal lines with error bars) and the observed transfer probabilities per possessor. The area of the symbols depicts the number of possessors per population and request status with the same transfer probability, such that larger symbols correspond to a greater number of possessors at that value (range: 1 to 8). NoReq, no request; Req, request.

