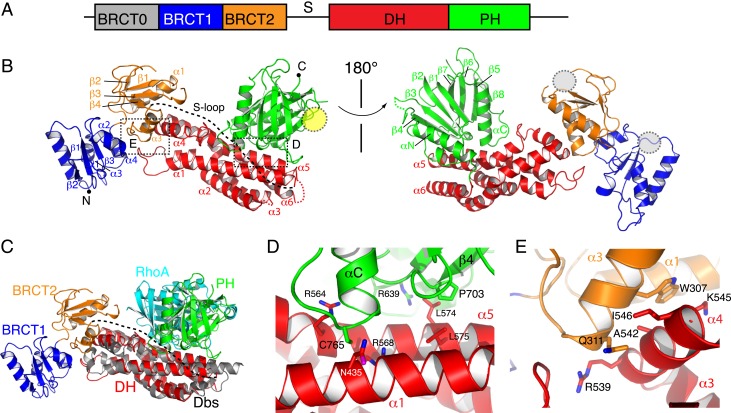
Fig. 1.
Structure of Ect2. (A) Domain organization of Ect2. (B) Two different views of the overall structure. The S-loop (dotted line) is disordered. The boxed regions are enlarged in D and E. The putative Cyk4 binding sites of the BRCT domains and the lipid-binding site of the PH domain are illustrated as gray and yellow ovals, respectively. (C) Structural alignment of the DH domains of Ect2 (color coded) and Dbs (in gray) bound with RhoA (in cyan) (PDB ID code 1lb1) (35). (D) DH–PH interactions. (E) DH–BRCT2 interactions.

