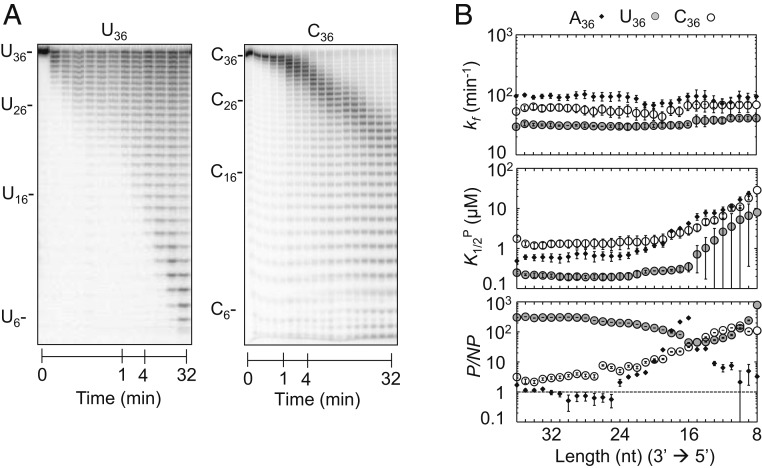
Fig. 3.
Degradation of U36 and C36. (A) Representative degradation reaction of U36 (1 nM; Rrp6p, 110 nM) and C36 (1 nM; Rrp6p, 110 nM). (B) Kinetic parameters for the degradation of U36 (solid circles) and C36 (open circles) for individual nucleotides (Top, degradation rate constant (kf); Middle, apparent dissociation constant for productive binding (K1/2P); Bottom, ratio between apparent productive and nonproductive dissociation constants (P/NP)). Data show results of the global data fit (SI Appendix, Fig. S4). Error bars mark the SEs of the global fit. The corresponding data for A36 (Fig. 2D) are shown for comparison.

